Swedish vs White/Caucasian Disability Age 35 to 64
COMPARE
Swedish
White/Caucasian
Disability Age 35 to 64
Disability Age 35 to 64 Comparison
Swedes
Whites/Caucasians
11.4%
DISABILITY AGE 35 TO 64
31.3/ 100
METRIC RATING
191st/ 347
METRIC RANK
12.6%
DISABILITY AGE 35 TO 64
0.3/ 100
METRIC RATING
266th/ 347
METRIC RANK
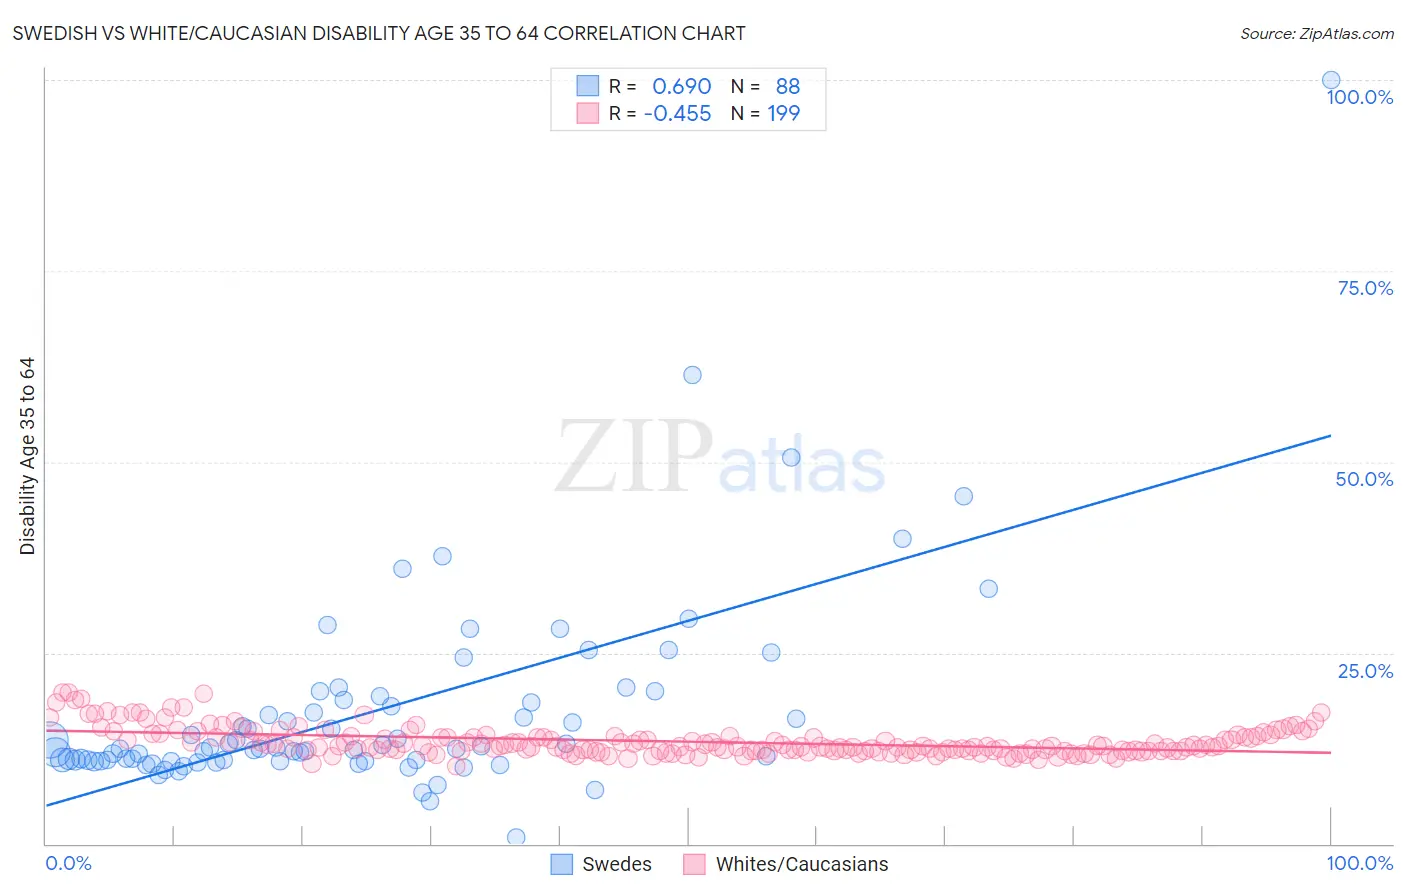
Swedish vs White/Caucasian Disability Age 35 to 64 Correlation Chart
The statistical analysis conducted on geographies consisting of 538,454,121 people shows a significant positive correlation between the proportion of Swedes and percentage of population with a disability between the ages 34 and 64 in the United States with a correlation coefficient (R) of 0.690 and weighted average of 11.4%. Similarly, the statistical analysis conducted on geographies consisting of 582,010,909 people shows a moderate negative correlation between the proportion of Whites/Caucasians and percentage of population with a disability between the ages 34 and 64 in the United States with a correlation coefficient (R) of -0.455 and weighted average of 12.6%, a difference of 10.2%.
Disability Age 35 to 64 Correlation Summary
| Measurement | Swedish | White/Caucasian |
| Minimum | 0.77% | 10.1% |
| Maximum | 100.0% | 19.8% |
| Range | 99.2% | 9.7% |
| Mean | 17.3% | 13.4% |
| Median | 12.5% | 12.7% |
| Interquartile 25% (IQ1) | 10.9% | 12.2% |
| Interquartile 75% (IQ3) | 18.6% | 14.0% |
| Interquartile Range (IQR) | 7.7% | 1.8% |
| Standard Deviation (Sample) | 13.3% | 1.8% |
| Standard Deviation (Population) | 13.3% | 1.8% |
Similar Demographics by Disability Age 35 to 64
Demographics Similar to Swedes by Disability Age 35 to 64
In terms of disability age 35 to 64, the demographic groups most similar to Swedes are Immigrants from Nigeria (11.4%, a difference of 0.11%), Norwegian (11.5%, a difference of 0.15%), Immigrants from Africa (11.5%, a difference of 0.22%), Hungarian (11.4%, a difference of 0.30%), and Northern European (11.4%, a difference of 0.32%).
| Demographics | Rating | Rank | Disability Age 35 to 64 |
| Kenyans | 39.2 /100 | #184 | Fair 11.4% |
| Danes | 36.8 /100 | #185 | Fair 11.4% |
| Slovenes | 36.6 /100 | #186 | Fair 11.4% |
| Immigrants | Bosnia and Herzegovina | 35.2 /100 | #187 | Fair 11.4% |
| Northern Europeans | 34.9 /100 | #188 | Fair 11.4% |
| Hungarians | 34.6 /100 | #189 | Fair 11.4% |
| Immigrants | Nigeria | 32.5 /100 | #190 | Fair 11.4% |
| Swedes | 31.3 /100 | #191 | Fair 11.4% |
| Norwegians | 29.7 /100 | #192 | Fair 11.5% |
| Immigrants | Africa | 29.0 /100 | #193 | Fair 11.5% |
| Immigrants | Latin America | 27.5 /100 | #194 | Fair 11.5% |
| Carpatho Rusyns | 25.3 /100 | #195 | Fair 11.5% |
| Iraqis | 24.2 /100 | #196 | Fair 11.5% |
| Immigrants | Iraq | 21.0 /100 | #197 | Fair 11.6% |
| Immigrants | Panama | 20.4 /100 | #198 | Fair 11.6% |
Demographics Similar to Whites/Caucasians by Disability Age 35 to 64
In terms of disability age 35 to 64, the demographic groups most similar to Whites/Caucasians are Subsaharan African (12.6%, a difference of 0.16%), Immigrants from Dominica (12.7%, a difference of 0.34%), Spanish (12.7%, a difference of 0.44%), French (12.7%, a difference of 0.48%), and Marshallese (12.5%, a difference of 0.71%).
| Demographics | Rating | Rank | Disability Age 35 to 64 |
| English | 0.6 /100 | #259 | Tragic 12.4% |
| German Russians | 0.5 /100 | #260 | Tragic 12.5% |
| Malaysians | 0.5 /100 | #261 | Tragic 12.5% |
| Senegalese | 0.5 /100 | #262 | Tragic 12.5% |
| Immigrants | Zaire | 0.4 /100 | #263 | Tragic 12.5% |
| Immigrants | Portugal | 0.4 /100 | #264 | Tragic 12.5% |
| Marshallese | 0.4 /100 | #265 | Tragic 12.5% |
| Whites/Caucasians | 0.3 /100 | #266 | Tragic 12.6% |
| Sub-Saharan Africans | 0.2 /100 | #267 | Tragic 12.6% |
| Immigrants | Dominica | 0.2 /100 | #268 | Tragic 12.7% |
| Spanish | 0.2 /100 | #269 | Tragic 12.7% |
| French | 0.2 /100 | #270 | Tragic 12.7% |
| Nepalese | 0.1 /100 | #271 | Tragic 12.8% |
| U.S. Virgin Islanders | 0.1 /100 | #272 | Tragic 12.8% |
| Pennsylvania Germans | 0.1 /100 | #273 | Tragic 12.8% |