Israeli vs Iraqi Disability Age 35 to 64
COMPARE
Israeli
Iraqi
Disability Age 35 to 64
Disability Age 35 to 64 Comparison
Israelis
Iraqis
9.7%
DISABILITY AGE 35 TO 64
99.9/ 100
METRIC RATING
41st/ 347
METRIC RANK
11.5%
DISABILITY AGE 35 TO 64
24.2/ 100
METRIC RATING
196th/ 347
METRIC RANK
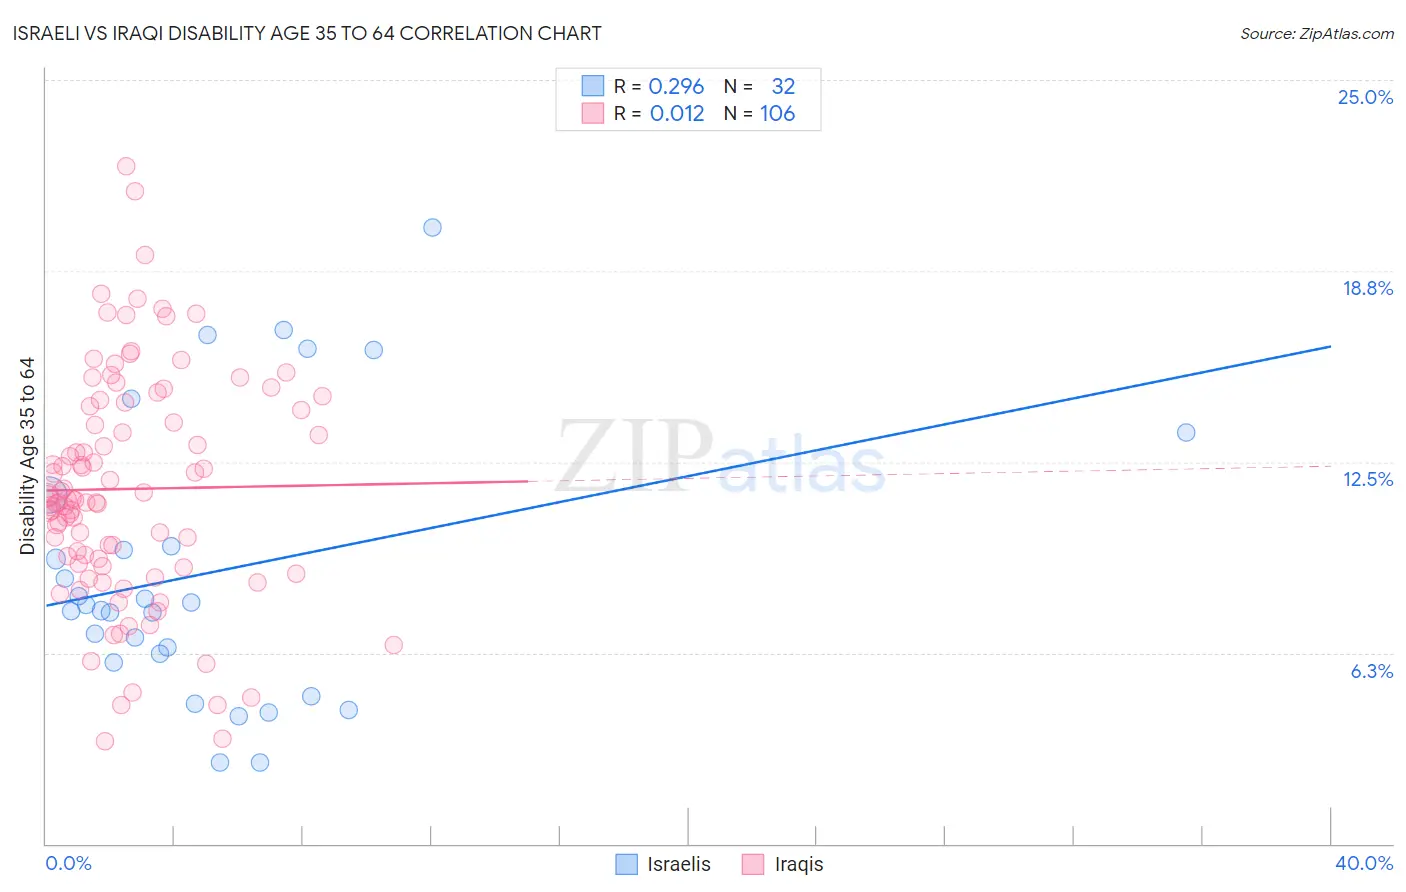
Israeli vs Iraqi Disability Age 35 to 64 Correlation Chart
The statistical analysis conducted on geographies consisting of 210,999,934 people shows a weak positive correlation between the proportion of Israelis and percentage of population with a disability between the ages 34 and 64 in the United States with a correlation coefficient (R) of 0.296 and weighted average of 9.7%. Similarly, the statistical analysis conducted on geographies consisting of 170,630,183 people shows no correlation between the proportion of Iraqis and percentage of population with a disability between the ages 34 and 64 in the United States with a correlation coefficient (R) of 0.012 and weighted average of 11.5%, a difference of 18.5%.
Disability Age 35 to 64 Correlation Summary
| Measurement | Israeli | Iraqi |
| Minimum | 2.6% | 3.3% |
| Maximum | 20.2% | 22.2% |
| Range | 17.5% | 18.8% |
| Mean | 8.9% | 11.6% |
| Median | 7.7% | 11.3% |
| Interquartile 25% (IQ1) | 6.1% | 9.1% |
| Interquartile 75% (IQ3) | 10.6% | 14.3% |
| Interquartile Range (IQR) | 4.5% | 5.2% |
| Standard Deviation (Sample) | 4.5% | 3.7% |
| Standard Deviation (Population) | 4.5% | 3.7% |
Similar Demographics by Disability Age 35 to 64
Demographics Similar to Israelis by Disability Age 35 to 64
In terms of disability age 35 to 64, the demographic groups most similar to Israelis are Immigrants from Armenia (9.7%, a difference of 0.12%), Immigrants from Belarus (9.7%, a difference of 0.18%), Immigrants from Malaysia (9.7%, a difference of 0.23%), Egyptian (9.7%, a difference of 0.35%), and Immigrants from Colombia (9.8%, a difference of 0.35%).
| Demographics | Rating | Rank | Disability Age 35 to 64 |
| Immigrants | Australia | 99.9 /100 | #34 | Exceptional 9.7% |
| Bulgarians | 99.9 /100 | #35 | Exceptional 9.7% |
| Immigrants | Cuba | 99.9 /100 | #36 | Exceptional 9.7% |
| Immigrants | Turkey | 99.9 /100 | #37 | Exceptional 9.7% |
| Egyptians | 99.9 /100 | #38 | Exceptional 9.7% |
| Immigrants | Belarus | 99.9 /100 | #39 | Exceptional 9.7% |
| Immigrants | Armenia | 99.9 /100 | #40 | Exceptional 9.7% |
| Israelis | 99.9 /100 | #41 | Exceptional 9.7% |
| Immigrants | Malaysia | 99.9 /100 | #42 | Exceptional 9.7% |
| Immigrants | Colombia | 99.9 /100 | #43 | Exceptional 9.8% |
| Immigrants | Egypt | 99.9 /100 | #44 | Exceptional 9.8% |
| Immigrants | Peru | 99.9 /100 | #45 | Exceptional 9.8% |
| Cambodians | 99.8 /100 | #46 | Exceptional 9.8% |
| Immigrants | Belgium | 99.8 /100 | #47 | Exceptional 9.8% |
| Immigrants | Serbia | 99.8 /100 | #48 | Exceptional 9.8% |
Demographics Similar to Iraqis by Disability Age 35 to 64
In terms of disability age 35 to 64, the demographic groups most similar to Iraqis are Carpatho Rusyn (11.5%, a difference of 0.12%), Immigrants from Latin America (11.5%, a difference of 0.34%), Immigrants from Iraq (11.6%, a difference of 0.36%), Immigrants from Panama (11.6%, a difference of 0.43%), and Immigrants from Africa (11.5%, a difference of 0.49%).
| Demographics | Rating | Rank | Disability Age 35 to 64 |
| Hungarians | 34.6 /100 | #189 | Fair 11.4% |
| Immigrants | Nigeria | 32.5 /100 | #190 | Fair 11.4% |
| Swedes | 31.3 /100 | #191 | Fair 11.4% |
| Norwegians | 29.7 /100 | #192 | Fair 11.5% |
| Immigrants | Africa | 29.0 /100 | #193 | Fair 11.5% |
| Immigrants | Latin America | 27.5 /100 | #194 | Fair 11.5% |
| Carpatho Rusyns | 25.3 /100 | #195 | Fair 11.5% |
| Iraqis | 24.2 /100 | #196 | Fair 11.5% |
| Immigrants | Iraq | 21.0 /100 | #197 | Fair 11.6% |
| Immigrants | Panama | 20.4 /100 | #198 | Fair 11.6% |
| Basques | 19.5 /100 | #199 | Poor 11.6% |
| Swiss | 18.7 /100 | #200 | Poor 11.6% |
| Immigrants | Kenya | 17.7 /100 | #201 | Poor 11.6% |
| Immigrants | Guatemala | 17.5 /100 | #202 | Poor 11.6% |
| British | 17.0 /100 | #203 | Poor 11.6% |