Immigrants from Venezuela vs Immigrants from Ukraine Vision Disability
COMPARE
Immigrants from Venezuela
Immigrants from Ukraine
Vision Disability
Vision Disability Comparison
Immigrants from Venezuela
Immigrants from Ukraine
2.1%
VISION DISABILITY
89.8/ 100
METRIC RATING
125th/ 347
METRIC RANK
2.1%
VISION DISABILITY
90.4/ 100
METRIC RATING
122nd/ 347
METRIC RANK
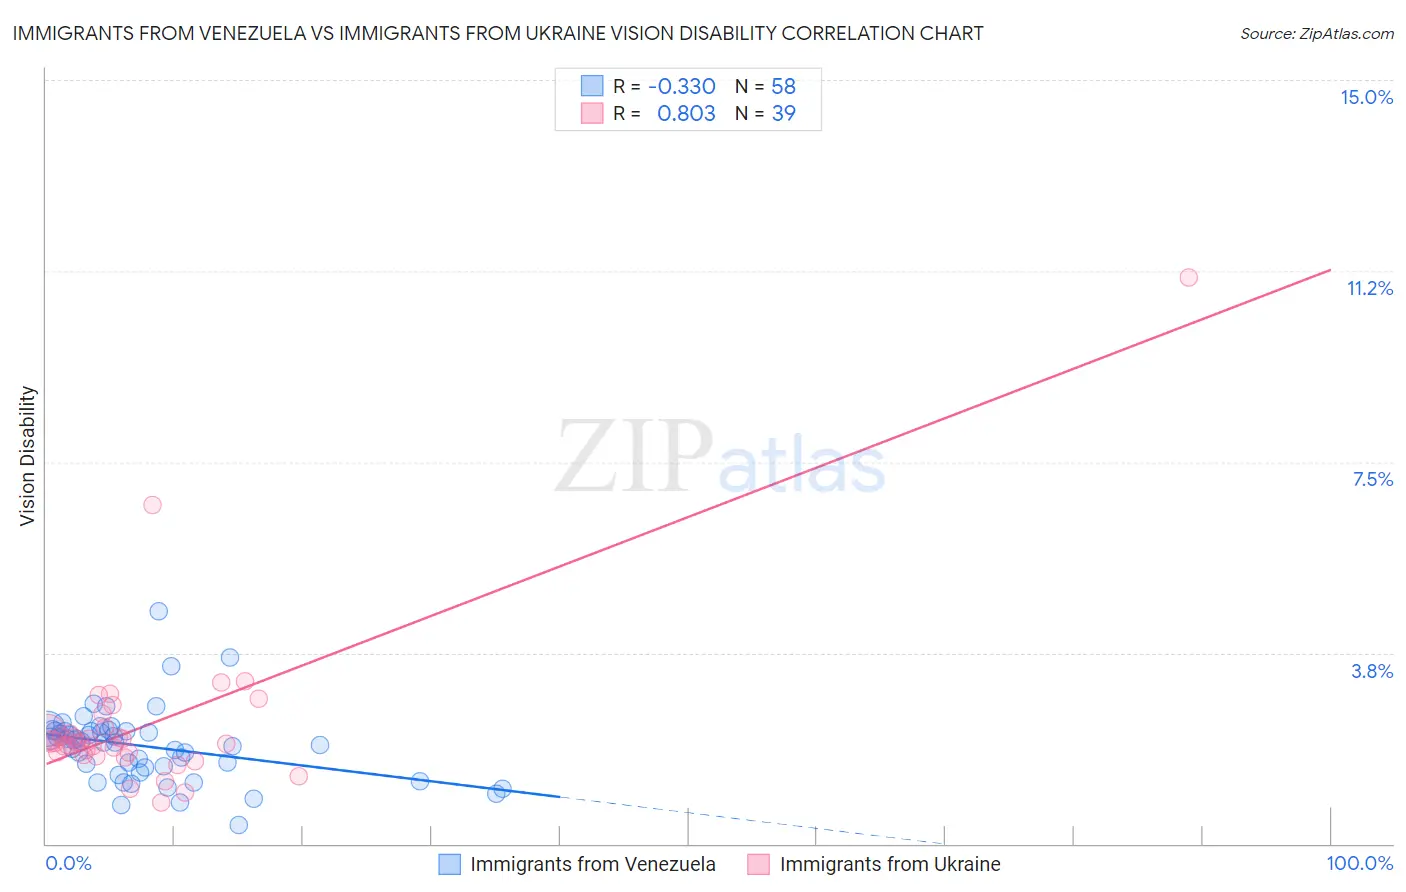
Immigrants from Venezuela vs Immigrants from Ukraine Vision Disability Correlation Chart
The statistical analysis conducted on geographies consisting of 287,771,852 people shows a mild negative correlation between the proportion of Immigrants from Venezuela and percentage of population with vision disability in the United States with a correlation coefficient (R) of -0.330 and weighted average of 2.1%. Similarly, the statistical analysis conducted on geographies consisting of 289,545,992 people shows a very strong positive correlation between the proportion of Immigrants from Ukraine and percentage of population with vision disability in the United States with a correlation coefficient (R) of 0.803 and weighted average of 2.1%, a difference of 0.11%.
Vision Disability Correlation Summary
| Measurement | Immigrants from Venezuela | Immigrants from Ukraine |
| Minimum | 0.36% | 0.80% |
| Maximum | 4.6% | 11.1% |
| Range | 4.2% | 10.3% |
| Mean | 1.9% | 2.4% |
| Median | 2.0% | 2.0% |
| Interquartile 25% (IQ1) | 1.5% | 1.8% |
| Interquartile 75% (IQ3) | 2.2% | 2.3% |
| Interquartile Range (IQR) | 0.71% | 0.53% |
| Standard Deviation (Sample) | 0.71% | 1.7% |
| Standard Deviation (Population) | 0.70% | 1.7% |
Demographics Similar to Immigrants from Venezuela and Immigrants from Ukraine by Vision Disability
In terms of vision disability, the demographic groups most similar to Immigrants from Venezuela are Immigrants from Spain (2.1%, a difference of 0.0%), Immigrants from Peru (2.1%, a difference of 0.040%), Sudanese (2.1%, a difference of 0.10%), Immigrants from Albania (2.1%, a difference of 0.11%), and Immigrants from Scotland (2.1%, a difference of 0.12%). Similarly, the demographic groups most similar to Immigrants from Ukraine are Immigrants from Albania (2.1%, a difference of 0.0%), Immigrants from Scotland (2.1%, a difference of 0.010%), Immigrants from Spain (2.1%, a difference of 0.11%), Immigrants from Zimbabwe (2.1%, a difference of 0.13%), and Immigrants from Peru (2.1%, a difference of 0.15%).
| Demographics | Rating | Rank | Vision Disability |
| Kenyans | 92.5 /100 | #113 | Exceptional 2.1% |
| Croatians | 92.3 /100 | #114 | Exceptional 2.1% |
| Immigrants | Vietnam | 92.2 /100 | #115 | Exceptional 2.1% |
| Ugandans | 92.2 /100 | #116 | Exceptional 2.1% |
| Poles | 92.0 /100 | #117 | Exceptional 2.1% |
| Immigrants | Philippines | 91.4 /100 | #118 | Exceptional 2.1% |
| Immigrants | Uganda | 91.4 /100 | #119 | Exceptional 2.1% |
| Immigrants | Zimbabwe | 91.0 /100 | #120 | Exceptional 2.1% |
| Immigrants | Scotland | 90.4 /100 | #121 | Exceptional 2.1% |
| Immigrants | Ukraine | 90.4 /100 | #122 | Exceptional 2.1% |
| Immigrants | Albania | 90.4 /100 | #123 | Exceptional 2.1% |
| Immigrants | Spain | 89.8 /100 | #124 | Excellent 2.1% |
| Immigrants | Venezuela | 89.8 /100 | #125 | Excellent 2.1% |
| Immigrants | Peru | 89.5 /100 | #126 | Excellent 2.1% |
| Sudanese | 89.2 /100 | #127 | Excellent 2.1% |
| Immigrants | Chile | 89.0 /100 | #128 | Excellent 2.1% |
| Immigrants | Cameroon | 88.8 /100 | #129 | Excellent 2.1% |
| Immigrants | Kenya | 88.7 /100 | #130 | Excellent 2.1% |
| Immigrants | Hungary | 88.7 /100 | #131 | Excellent 2.1% |
| New Zealanders | 88.2 /100 | #132 | Excellent 2.1% |
| Syrians | 87.5 /100 | #133 | Excellent 2.1% |