Immigrants from Venezuela vs Immigrants from Ecuador Disability Age 5 to 17
COMPARE
Immigrants from Venezuela
Immigrants from Ecuador
Disability Age 5 to 17
Disability Age 5 to 17 Comparison
Immigrants from Venezuela
Immigrants from Ecuador
5.4%
DISABILITY AGE 5 TO 17
94.5/ 100
METRIC RATING
128th/ 347
METRIC RANK
5.5%
DISABILITY AGE 5 TO 17
78.3/ 100
METRIC RATING
155th/ 347
METRIC RANK
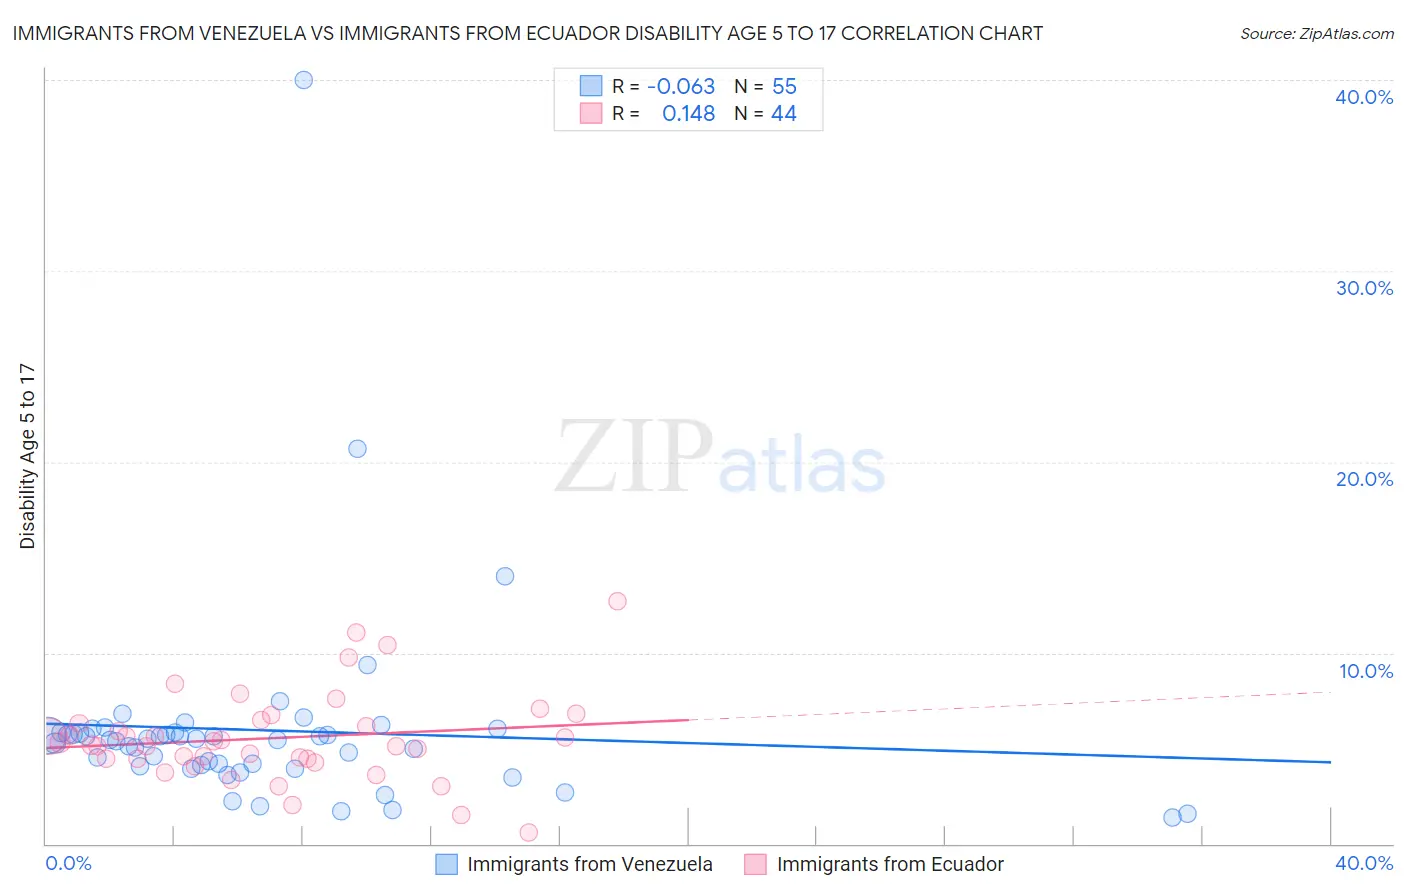
Immigrants from Venezuela vs Immigrants from Ecuador Disability Age 5 to 17 Correlation Chart
The statistical analysis conducted on geographies consisting of 286,570,135 people shows a slight negative correlation between the proportion of Immigrants from Venezuela and percentage of population with a disability between the ages 5 and 17 in the United States with a correlation coefficient (R) of -0.063 and weighted average of 5.4%. Similarly, the statistical analysis conducted on geographies consisting of 269,602,544 people shows a poor positive correlation between the proportion of Immigrants from Ecuador and percentage of population with a disability between the ages 5 and 17 in the United States with a correlation coefficient (R) of 0.148 and weighted average of 5.5%, a difference of 2.0%.
Disability Age 5 to 17 Correlation Summary
| Measurement | Immigrants from Venezuela | Immigrants from Ecuador |
| Minimum | 1.4% | 0.57% |
| Maximum | 40.0% | 12.7% |
| Range | 38.6% | 12.1% |
| Mean | 5.9% | 5.5% |
| Median | 5.5% | 5.2% |
| Interquartile 25% (IQ1) | 4.1% | 4.4% |
| Interquartile 75% (IQ3) | 5.8% | 6.4% |
| Interquartile Range (IQR) | 1.8% | 2.0% |
| Standard Deviation (Sample) | 5.5% | 2.4% |
| Standard Deviation (Population) | 5.5% | 2.3% |
Similar Demographics by Disability Age 5 to 17
Demographics Similar to Immigrants from Venezuela by Disability Age 5 to 17
In terms of disability age 5 to 17, the demographic groups most similar to Immigrants from Venezuela are Romanian (5.4%, a difference of 0.090%), Latvian (5.4%, a difference of 0.11%), Immigrants from Bulgaria (5.4%, a difference of 0.11%), New Zealander (5.4%, a difference of 0.12%), and Immigrants from Chile (5.4%, a difference of 0.13%).
| Demographics | Rating | Rank | Disability Age 5 to 17 |
| Maltese | 96.0 /100 | #121 | Exceptional 5.4% |
| Chileans | 95.8 /100 | #122 | Exceptional 5.4% |
| Immigrants | Ethiopia | 95.5 /100 | #123 | Exceptional 5.4% |
| Crow | 95.0 /100 | #124 | Exceptional 5.4% |
| Immigrants | Chile | 95.0 /100 | #125 | Exceptional 5.4% |
| New Zealanders | 95.0 /100 | #126 | Exceptional 5.4% |
| Latvians | 95.0 /100 | #127 | Exceptional 5.4% |
| Immigrants | Venezuela | 94.5 /100 | #128 | Exceptional 5.4% |
| Romanians | 94.1 /100 | #129 | Exceptional 5.4% |
| Immigrants | Bulgaria | 94.0 /100 | #130 | Exceptional 5.4% |
| Arabs | 92.9 /100 | #131 | Exceptional 5.4% |
| Immigrants | Colombia | 92.9 /100 | #132 | Exceptional 5.4% |
| Venezuelans | 92.7 /100 | #133 | Exceptional 5.4% |
| Yuman | 92.3 /100 | #134 | Exceptional 5.4% |
| Immigrants | Belize | 91.7 /100 | #135 | Exceptional 5.4% |
Demographics Similar to Immigrants from Ecuador by Disability Age 5 to 17
In terms of disability age 5 to 17, the demographic groups most similar to Immigrants from Ecuador are Hawaiian (5.5%, a difference of 0.020%), Immigrants from Costa Rica (5.5%, a difference of 0.030%), Australian (5.5%, a difference of 0.040%), Immigrants from Nepal (5.5%, a difference of 0.080%), and Ecuadorian (5.5%, a difference of 0.11%).
| Demographics | Rating | Rank | Disability Age 5 to 17 |
| Samoans | 81.9 /100 | #148 | Excellent 5.5% |
| Central Americans | 81.6 /100 | #149 | Excellent 5.5% |
| Guatemalans | 81.5 /100 | #150 | Excellent 5.5% |
| Estonians | 80.8 /100 | #151 | Excellent 5.5% |
| Ute | 80.6 /100 | #152 | Excellent 5.5% |
| Ecuadorians | 79.7 /100 | #153 | Good 5.5% |
| Australians | 78.8 /100 | #154 | Good 5.5% |
| Immigrants | Ecuador | 78.3 /100 | #155 | Good 5.5% |
| Hawaiians | 78.0 /100 | #156 | Good 5.5% |
| Immigrants | Costa Rica | 77.9 /100 | #157 | Good 5.5% |
| Immigrants | Nepal | 77.1 /100 | #158 | Good 5.5% |
| Immigrants | Zimbabwe | 75.3 /100 | #159 | Good 5.5% |
| South Africans | 73.3 /100 | #160 | Good 5.5% |
| Immigrants | Saudi Arabia | 69.1 /100 | #161 | Good 5.5% |
| Zimbabweans | 67.2 /100 | #162 | Good 5.5% |