Immigrants from Korea vs Eastern European Disability Age Over 75
COMPARE
Immigrants from Korea
Eastern European
Disability Age Over 75
Disability Age Over 75 Comparison
Immigrants from Korea
Eastern Europeans
45.8%
DISABILITY AGE OVER 75
99.7/ 100
METRIC RATING
51st/ 347
METRIC RANK
44.8%
DISABILITY AGE OVER 75
100.0/ 100
METRIC RATING
3rd/ 347
METRIC RANK
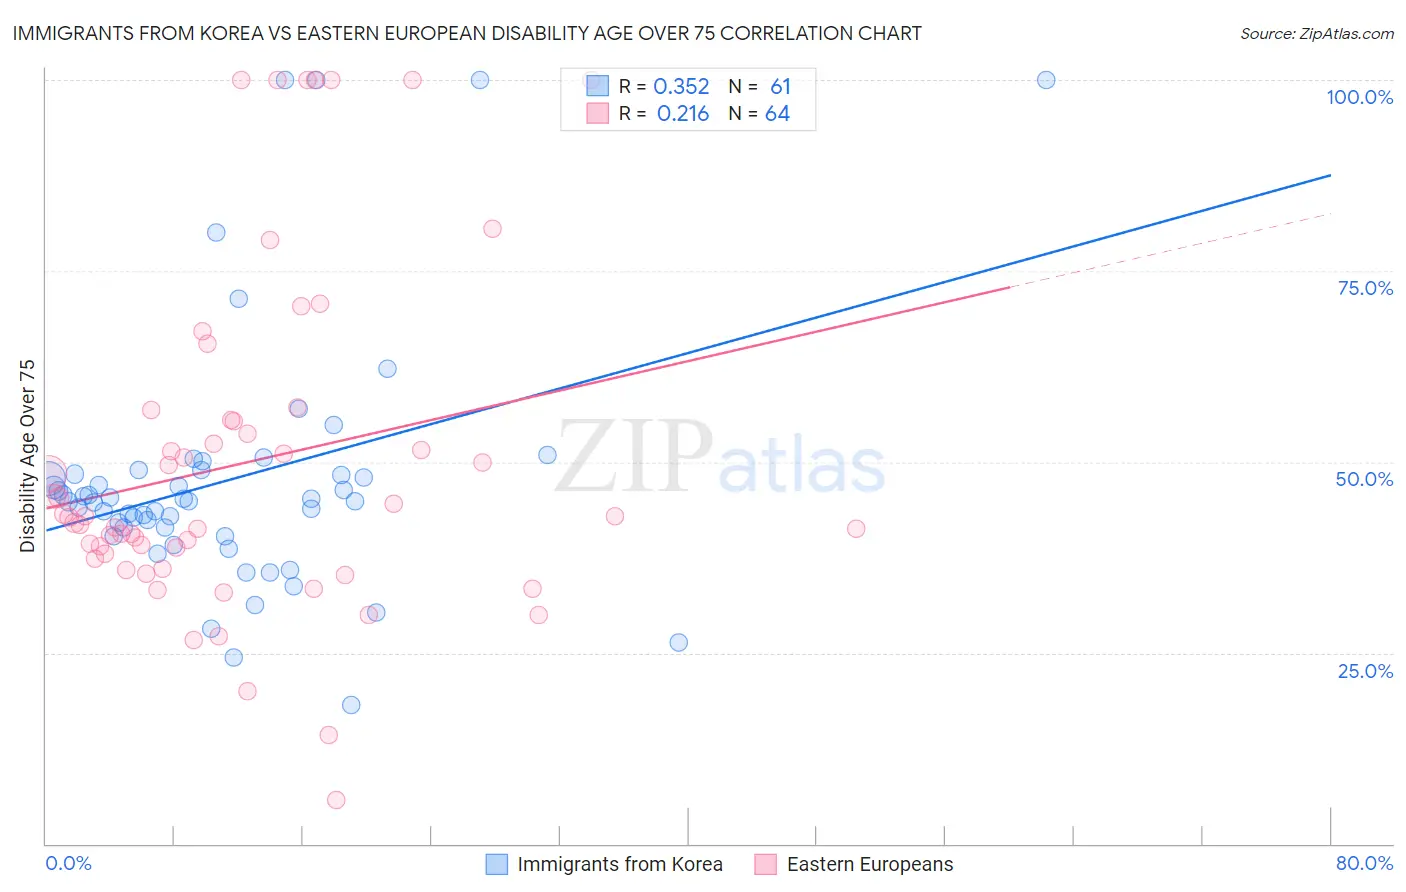
Immigrants from Korea vs Eastern European Disability Age Over 75 Correlation Chart
The statistical analysis conducted on geographies consisting of 415,245,422 people shows a mild positive correlation between the proportion of Immigrants from Korea and percentage of population with a disability over the age of 75 in the United States with a correlation coefficient (R) of 0.352 and weighted average of 45.8%. Similarly, the statistical analysis conducted on geographies consisting of 460,398,021 people shows a weak positive correlation between the proportion of Eastern Europeans and percentage of population with a disability over the age of 75 in the United States with a correlation coefficient (R) of 0.216 and weighted average of 44.8%, a difference of 2.2%.
Disability Age Over 75 Correlation Summary
| Measurement | Immigrants from Korea | Eastern European |
| Minimum | 18.2% | 5.7% |
| Maximum | 100.0% | 100.0% |
| Range | 81.8% | 94.3% |
| Mean | 47.7% | 49.9% |
| Median | 44.9% | 42.8% |
| Interquartile 25% (IQ1) | 40.9% | 37.7% |
| Interquartile 75% (IQ3) | 48.6% | 55.5% |
| Interquartile Range (IQR) | 7.8% | 17.8% |
| Standard Deviation (Sample) | 16.9% | 22.1% |
| Standard Deviation (Population) | 16.7% | 21.9% |
Similar Demographics by Disability Age Over 75
Demographics Similar to Immigrants from Korea by Disability Age Over 75
In terms of disability age over 75, the demographic groups most similar to Immigrants from Korea are Belgian (45.8%, a difference of 0.0%), Immigrants from France (45.8%, a difference of 0.050%), Immigrants from Italy (45.8%, a difference of 0.060%), Immigrants from North America (45.7%, a difference of 0.13%), and Slovak (45.8%, a difference of 0.14%).
| Demographics | Rating | Rank | Disability Age Over 75 |
| Australians | 99.8 /100 | #44 | Exceptional 45.7% |
| Turks | 99.8 /100 | #45 | Exceptional 45.7% |
| Swedes | 99.8 /100 | #46 | Exceptional 45.7% |
| Immigrants | Canada | 99.8 /100 | #47 | Exceptional 45.7% |
| Croatians | 99.8 /100 | #48 | Exceptional 45.7% |
| Immigrants | North America | 99.8 /100 | #49 | Exceptional 45.7% |
| Belgians | 99.7 /100 | #50 | Exceptional 45.8% |
| Immigrants | Korea | 99.7 /100 | #51 | Exceptional 45.8% |
| Immigrants | France | 99.7 /100 | #52 | Exceptional 45.8% |
| Immigrants | Italy | 99.7 /100 | #53 | Exceptional 45.8% |
| Slovaks | 99.6 /100 | #54 | Exceptional 45.8% |
| Maltese | 99.6 /100 | #55 | Exceptional 45.8% |
| Immigrants | Netherlands | 99.6 /100 | #56 | Exceptional 45.9% |
| Immigrants | Turkey | 99.6 /100 | #57 | Exceptional 45.9% |
| Immigrants | Israel | 99.6 /100 | #58 | Exceptional 45.9% |
Demographics Similar to Eastern Europeans by Disability Age Over 75
In terms of disability age over 75, the demographic groups most similar to Eastern Europeans are Carpatho Rusyn (44.8%, a difference of 0.030%), Luxembourger (44.8%, a difference of 0.090%), Immigrants from Lithuania (44.9%, a difference of 0.18%), Okinawan (44.9%, a difference of 0.22%), and Immigrants from Ireland (44.7%, a difference of 0.29%).
| Demographics | Rating | Rank | Disability Age Over 75 |
| Cypriots | 100.0 /100 | #1 | Exceptional 43.5% |
| Immigrants | Ireland | 100.0 /100 | #2 | Exceptional 44.7% |
| Eastern Europeans | 100.0 /100 | #3 | Exceptional 44.8% |
| Carpatho Rusyns | 100.0 /100 | #4 | Exceptional 44.8% |
| Luxembourgers | 100.0 /100 | #5 | Exceptional 44.8% |
| Immigrants | Lithuania | 100.0 /100 | #6 | Exceptional 44.9% |
| Okinawans | 100.0 /100 | #7 | Exceptional 44.9% |
| Immigrants | Austria | 100.0 /100 | #8 | Exceptional 44.9% |
| Paraguayans | 100.0 /100 | #9 | Exceptional 45.0% |
| Bulgarians | 100.0 /100 | #10 | Exceptional 45.1% |
| Lithuanians | 100.0 /100 | #11 | Exceptional 45.1% |
| Immigrants | Czechoslovakia | 100.0 /100 | #12 | Exceptional 45.1% |
| Latvians | 100.0 /100 | #13 | Exceptional 45.1% |
| Immigrants | Scotland | 100.0 /100 | #14 | Exceptional 45.1% |
| Immigrants | Sweden | 100.0 /100 | #15 | Exceptional 45.1% |