Immigrants from Ukraine vs German Russian Cognitive Disability
COMPARE
Immigrants from Ukraine
German Russian
Cognitive Disability
Cognitive Disability Comparison
Immigrants from Ukraine
German Russians
16.6%
COGNITIVE DISABILITY
99.5/ 100
METRIC RATING
66th/ 347
METRIC RANK
18.2%
COGNITIVE DISABILITY
0.0/ 100
METRIC RATING
295th/ 347
METRIC RANK
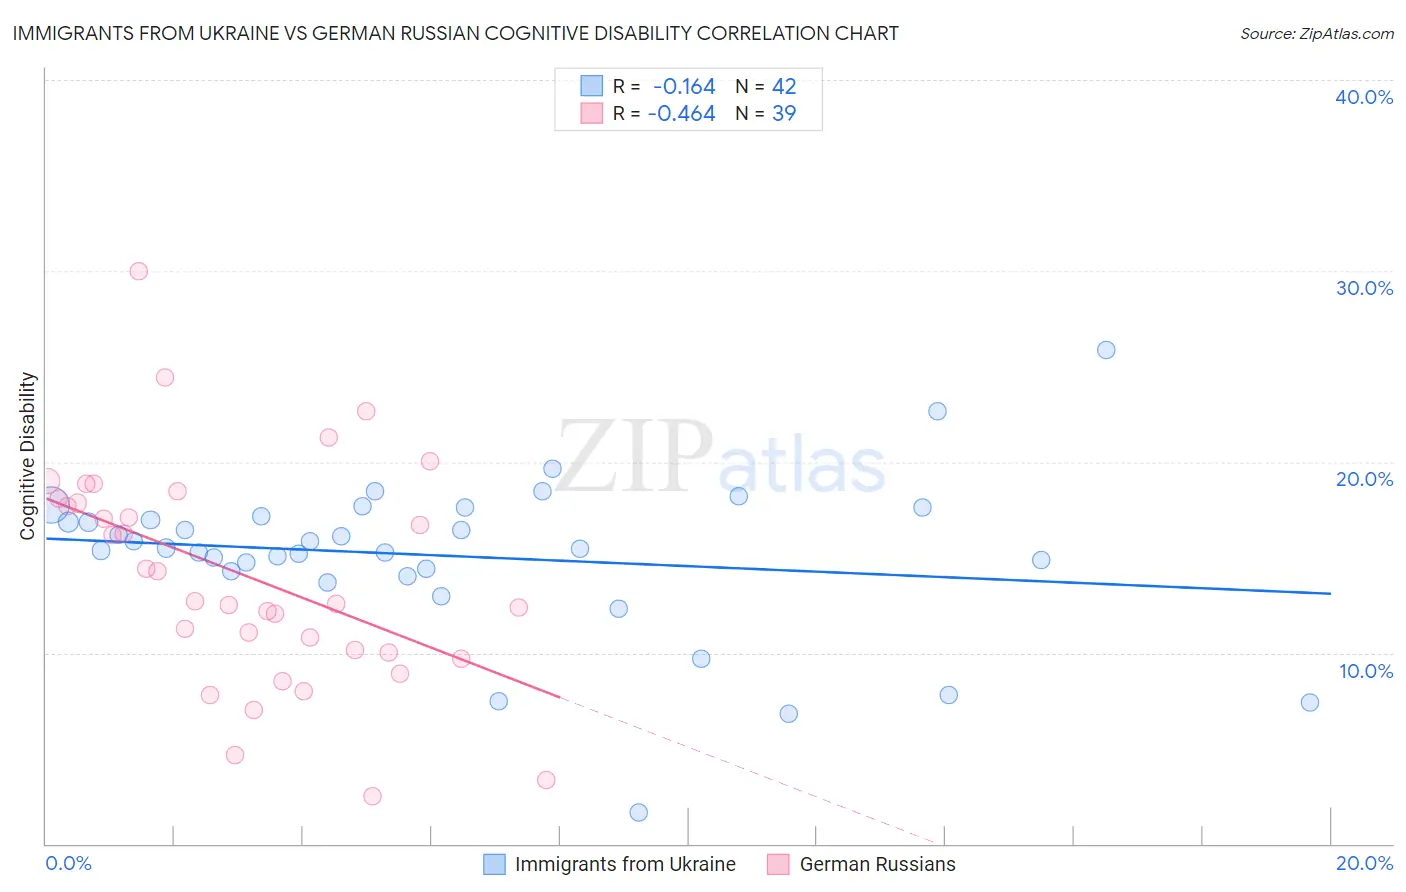
Immigrants from Ukraine vs German Russian Cognitive Disability Correlation Chart
The statistical analysis conducted on geographies consisting of 289,689,881 people shows a poor negative correlation between the proportion of Immigrants from Ukraine and percentage of population with cognitive disability in the United States with a correlation coefficient (R) of -0.164 and weighted average of 16.6%. Similarly, the statistical analysis conducted on geographies consisting of 96,458,648 people shows a moderate negative correlation between the proportion of German Russians and percentage of population with cognitive disability in the United States with a correlation coefficient (R) of -0.464 and weighted average of 18.2%, a difference of 9.6%.
Cognitive Disability Correlation Summary
| Measurement | Immigrants from Ukraine | German Russian |
| Minimum | 1.6% | 2.5% |
| Maximum | 25.9% | 30.0% |
| Range | 24.3% | 27.6% |
| Mean | 15.1% | 14.0% |
| Median | 15.5% | 12.7% |
| Interquartile 25% (IQ1) | 14.3% | 10.0% |
| Interquartile 75% (IQ3) | 17.1% | 18.1% |
| Interquartile Range (IQR) | 2.9% | 8.0% |
| Standard Deviation (Sample) | 4.2% | 5.9% |
| Standard Deviation (Population) | 4.2% | 5.8% |
Similar Demographics by Cognitive Disability
Demographics Similar to Immigrants from Ukraine by Cognitive Disability
In terms of cognitive disability, the demographic groups most similar to Immigrants from Ukraine are Latvian (16.6%, a difference of 0.040%), Ukrainian (16.6%, a difference of 0.080%), Colombian (16.6%, a difference of 0.12%), Venezuelan (16.6%, a difference of 0.14%), and Immigrants from Uzbekistan (16.7%, a difference of 0.16%).
| Demographics | Rating | Rank | Cognitive Disability |
| Immigrants | Peru | 99.7 /100 | #59 | Exceptional 16.6% |
| Romanians | 99.7 /100 | #60 | Exceptional 16.6% |
| Immigrants | England | 99.6 /100 | #61 | Exceptional 16.6% |
| Czechoslovakians | 99.6 /100 | #62 | Exceptional 16.6% |
| Argentineans | 99.6 /100 | #63 | Exceptional 16.6% |
| Venezuelans | 99.6 /100 | #64 | Exceptional 16.6% |
| Colombians | 99.6 /100 | #65 | Exceptional 16.6% |
| Immigrants | Ukraine | 99.5 /100 | #66 | Exceptional 16.6% |
| Latvians | 99.5 /100 | #67 | Exceptional 16.6% |
| Ukrainians | 99.4 /100 | #68 | Exceptional 16.6% |
| Immigrants | Uzbekistan | 99.4 /100 | #69 | Exceptional 16.7% |
| Immigrants | Sweden | 99.4 /100 | #70 | Exceptional 16.7% |
| Immigrants | Belgium | 99.3 /100 | #71 | Exceptional 16.7% |
| Germans | 99.3 /100 | #72 | Exceptional 16.7% |
| Burmese | 99.3 /100 | #73 | Exceptional 16.7% |
Demographics Similar to German Russians by Cognitive Disability
In terms of cognitive disability, the demographic groups most similar to German Russians are Immigrants from Burma/Myanmar (18.2%, a difference of 0.020%), British West Indian (18.2%, a difference of 0.17%), Blackfeet (18.3%, a difference of 0.17%), Japanese (18.3%, a difference of 0.17%), and Ghanaian (18.3%, a difference of 0.20%).
| Demographics | Rating | Rank | Cognitive Disability |
| Immigrants | West Indies | 0.1 /100 | #288 | Tragic 18.1% |
| Natives/Alaskans | 0.1 /100 | #289 | Tragic 18.1% |
| Immigrants | Africa | 0.1 /100 | #290 | Tragic 18.1% |
| Ottawa | 0.1 /100 | #291 | Tragic 18.2% |
| Iroquois | 0.1 /100 | #292 | Tragic 18.2% |
| Central American Indians | 0.1 /100 | #293 | Tragic 18.2% |
| British West Indians | 0.1 /100 | #294 | Tragic 18.2% |
| German Russians | 0.0 /100 | #295 | Tragic 18.2% |
| Immigrants | Burma/Myanmar | 0.0 /100 | #296 | Tragic 18.2% |
| Blackfeet | 0.0 /100 | #297 | Tragic 18.3% |
| Japanese | 0.0 /100 | #298 | Tragic 18.3% |
| Ghanaians | 0.0 /100 | #299 | Tragic 18.3% |
| Creek | 0.0 /100 | #300 | Tragic 18.3% |
| Immigrants | Ghana | 0.0 /100 | #301 | Tragic 18.3% |
| Barbadians | 0.0 /100 | #302 | Tragic 18.3% |