Immigrants from Trinidad and Tobago vs Immigrants from North Macedonia Disability Age Over 75

COMPARE

Immigrants from Trinidad and Tobago
Race
Ancestry
AfghanAfricanAlaska NativeAlaskan AthabascanAlbanianAleutAlsatianAmericanApacheArabArapahoArgentineanArmenianAssyrian/Chaldean/SyriacAustralianAustrianBahamianBangladeshiBarbadianBasqueBelgianBelizeanBermudanBhutaneseBlackfeetBolivianBrazilianBritishBritish West IndianBulgarianBurmeseCajunCambodianCanadianCape VerdeanCarpatho RusynCelticCentral AmericanCentral American IndianCherokeeCheyenneChickasawChileanChineseChippewaChoctawColombianColvilleComancheCosta RicanCreeCreekCroatianCrowCubanCypriotCzechCzechoslovakianDanishDelawareDominicanDutchDutch West IndianEastern EuropeanEcuadorianEgyptianEnglishEstonianEthiopianEuropeanFijianFilipinoFinnishFrenchFrench American IndianFrench CanadianGermanGerman RussianGhanaianGreekGuamanian/ChamorroGuatemalanGuyaneseHaitianHmongHonduranHopiHoumaHungarianIcelanderIndian (Asian)IndonesianInupiatIranianIraqiIrishIroquoisIsraeliItalianJamaicanJapaneseJordanianKenyanKiowaKoreanLaotianLatvianLebaneseLiberianLithuanianLumbeeLuxembourgerMacedonianMalaysianMalteseMarshalleseMenomineeMexicanMexican American IndianMongolianMoroccanNative HawaiianNavajoNepaleseNew ZealanderNicaraguanNigerianNorthern EuropeanNorwegianOkinawanOsageOttawaPaiutePakistaniPalestinianPanamanianParaguayanPennsylvania GermanPeruvianPimaPolishPortuguesePotawatomiPuebloPuerto RicanPuget Sound SalishRomanianRussianSalvadoranSamoanScandinavianScotch-IrishScottishSeminoleSenegaleseSerbianShoshoneSierra LeoneanSiouxSlavicSlovakSloveneSomaliSouth AfricanSouth AmericanSouth American IndianSoviet UnionSpaniardSpanishSpanish AmericanSpanish American IndianSri LankanSubsaharan AfricanSudaneseSwedishSwissSyrianTaiwaneseThaiTlingit-HaidaTohono O'OdhamTonganTrinidadian and TobagonianTsimshianTurkishU.S. Virgin IslanderUgandanUkrainianUruguayanUteVenezuelanVietnameseWelshWest IndianYakamaYaquiYugoslavianYumanYup'ikZimbabwean
Immigration
NonimmigrantsImmigrantsAfghanistanAfricaAlbaniaArgentinaArmeniaAsiaAustraliaAustriaBahamasBangladeshBarbadosBelarusBelgiumBelizeBoliviaBosnia and HerzegovinaBrazilBulgariaBurma/MyanmarCabo VerdeCambodiaCameroonCanadaCaribbeanCentral AmericaChileChinaColombiaCongoCosta RicaCroatiaCubaCzechoslovakiaDenmarkDominicaDominican RepublicEastern AfricaEastern AsiaEastern EuropeEcuadorEgyptEl SalvadorEnglandEritreaEthiopiaEuropeFijiFranceGermanyGhanaGreeceGrenadaGuatemalaGuyanaHaitiHondurasHong KongHungaryIndiaIndonesiaIranIraqIrelandIsraelItalyJamaicaJapanJordanKazakhstanKenyaKoreaKuwaitLaosLatin AmericaLatviaLebanonLiberiaLithuaniaMalaysiaMexicoMicronesiaMiddle AfricaMoldovaMoroccoNepalNetherlandsNicaraguaNigeriaNorth AmericaNorthern AfricaNorthern EuropeNorwayOceaniaPakistanPanamaPeruPhilippinesPolandPortugalRomaniaRussiaSaudi ArabiaScotlandSenegalSerbiaSierra LeoneSingaporeSomaliaSouth AfricaSouth AmericaSouth Central AsiaSouth Eastern AsiaSouthern EuropeSpainSri LankaSt. Vincent and the GrenadinesSudanSwedenSwitzerlandSyriaTaiwanThailandTrinidad and TobagoTurkeyUgandaUkraineUruguayUzbekistanVenezuelaVietnamWest IndiesWestern AfricaWestern AsiaWestern EuropeYemenZaireZimbabweAzores
Immigrants from North Macedonia
Race
Ancestry
AfghanAfricanAlaska NativeAlaskan AthabascanAlbanianAleutAlsatianAmericanApacheArabArapahoArgentineanArmenianAssyrian/Chaldean/SyriacAustralianAustrianBahamianBangladeshiBarbadianBasqueBelgianBelizeanBermudanBhutaneseBlackfeetBolivianBrazilianBritishBritish West IndianBulgarianBurmeseCajunCambodianCanadianCape VerdeanCarpatho RusynCelticCentral AmericanCentral American IndianCherokeeCheyenneChickasawChileanChineseChippewaChoctawColombianColvilleComancheCosta RicanCreeCreekCroatianCrowCubanCypriotCzechCzechoslovakianDanishDelawareDominicanDutchDutch West IndianEastern EuropeanEcuadorianEgyptianEnglishEstonianEthiopianEuropeanFijianFilipinoFinnishFrenchFrench American IndianFrench CanadianGermanGerman RussianGhanaianGreekGuamanian/ChamorroGuatemalanGuyaneseHaitianHmongHonduranHopiHoumaHungarianIcelanderIndian (Asian)IndonesianInupiatIranianIraqiIrishIroquoisIsraeliItalianJamaicanJapaneseJordanianKenyanKiowaKoreanLaotianLatvianLebaneseLiberianLithuanianLumbeeLuxembourgerMacedonianMalaysianMalteseMarshalleseMenomineeMexicanMexican American IndianMongolianMoroccanNative HawaiianNavajoNepaleseNew ZealanderNicaraguanNigerianNorthern EuropeanNorwegianOkinawanOsageOttawaPaiutePakistaniPalestinianPanamanianParaguayanPennsylvania GermanPeruvianPimaPolishPortuguesePotawatomiPuebloPuerto RicanPuget Sound SalishRomanianRussianSalvadoranSamoanScandinavianScotch-IrishScottishSeminoleSenegaleseSerbianShoshoneSierra LeoneanSiouxSlavicSlovakSloveneSomaliSouth AfricanSouth AmericanSouth American IndianSoviet UnionSpaniardSpanishSpanish AmericanSpanish American IndianSri LankanSubsaharan AfricanSudaneseSwedishSwissSyrianTaiwaneseThaiTlingit-HaidaTohono O'OdhamTonganTrinidadian and TobagonianTsimshianTurkishU.S. Virgin IslanderUgandanUkrainianUruguayanUteVenezuelanVietnameseWelshWest IndianYakamaYaquiYugoslavianYumanYup'ikZimbabwean
Immigration
NonimmigrantsImmigrantsAfghanistanAfricaAlbaniaArgentinaArmeniaAsiaAustraliaAustriaBahamasBangladeshBarbadosBelarusBelgiumBelizeBoliviaBosnia and HerzegovinaBrazilBulgariaBurma/MyanmarCabo VerdeCambodiaCameroonCanadaCaribbeanCentral AmericaChileChinaColombiaCongoCosta RicaCroatiaCubaCzechoslovakiaDenmarkDominicaDominican RepublicEastern AfricaEastern AsiaEastern EuropeEcuadorEgyptEl SalvadorEnglandEritreaEthiopiaEuropeFijiFranceGermanyGhanaGreeceGrenadaGuatemalaGuyanaHaitiHondurasHong KongHungaryIndiaIndonesiaIranIraqIrelandIsraelItalyJamaicaJapanJordanKazakhstanKenyaKoreaKuwaitLaosLatin AmericaLatviaLebanonLiberiaLithuaniaMalaysiaMexicoMicronesiaMiddle AfricaMoldovaMoroccoNepalNetherlandsNicaraguaNigeriaNorth AmericaNorth MacedoniaNorthern AfricaNorthern EuropeNorwayOceaniaPakistanPanamaPeruPhilippinesPolandPortugalRomaniaRussiaSaudi ArabiaScotlandSenegalSerbiaSierra LeoneSingaporeSomaliaSouth AfricaSouth AmericaSouth Central AsiaSouth Eastern AsiaSouthern EuropeSpainSri LankaSt. Vincent and the GrenadinesSudanSwedenSwitzerlandSyriaTaiwanThailandTurkeyUgandaUkraineUruguayUzbekistanVenezuelaVietnamWest IndiesWestern AfricaWestern AsiaWestern EuropeYemenZaireZimbabweAzores
Disability Age Over 75
Income
Poverty
Unemployment
Labor Participation
Family Structure
Vehicle Availability
Education Level
Disability

Disability Age Over 75 Comparison

Immigrants from Trinidad and Tobago

Immigrants from North Macedonia

Fair
Exceptional
47.6%
DISABILITY AGE OVER 75
25.3/ 100
METRIC RATING
195th/ 347
METRIC RANK
45.9%
DISABILITY AGE OVER 75
99.5/ 100
METRIC RATING
64th/ 347
METRIC RANK

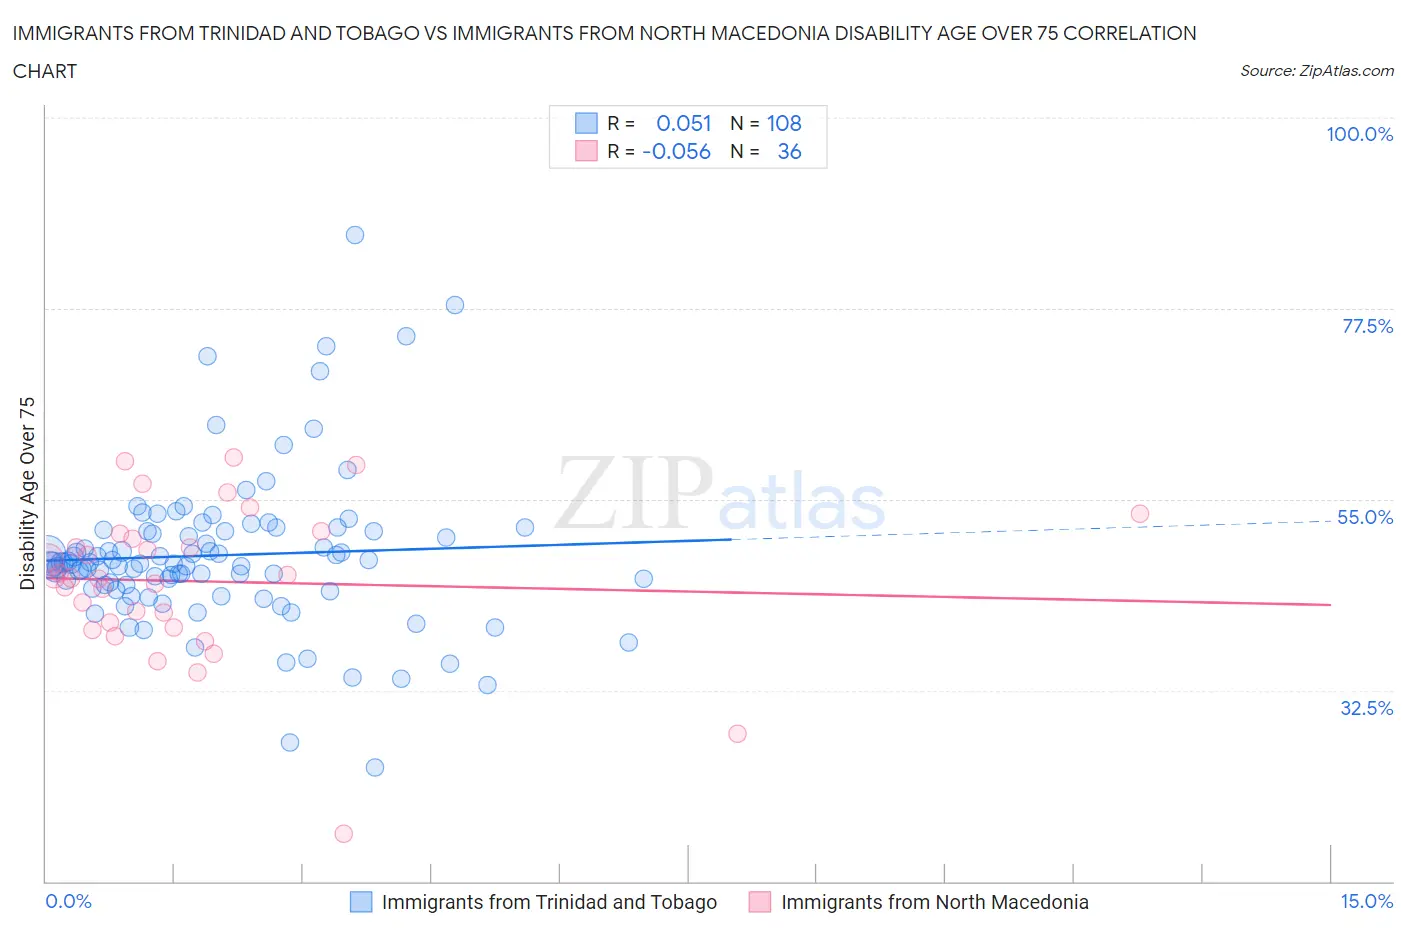
Immigrants from Trinidad and Tobago vs Immigrants from North Macedonia Disability Age Over 75 Correlation Chart

The statistical analysis conducted on geographies consisting of 223,345,670 people shows a slight positive correlation between the proportion of Immigrants from Trinidad and Tobago and percentage of population with a disability over the age of 75 in the United States with a correlation coefficient (R) of 0.051 and weighted average of 47.6%. Similarly, the statistical analysis conducted on geographies consisting of 74,296,961 people shows a slight negative correlation between the proportion of Immigrants from North Macedonia and percentage of population with a disability over the age of 75 in the United States with a correlation coefficient (R) of -0.056 and weighted average of 45.9%, a difference of 3.7%.
Immigrants from Trinidad and Tobago vs Immigrants from North Macedonia Disability Age Over 75

Disability Age Over 75 Correlation Summary

MeasurementImmigrants from Trinidad and TobagoImmigrants from North Macedonia
Minimum23.3%15.6%
Maximum86.1%59.9%
Range62.8%44.3%
Mean48.4%45.3%
Median47.4%45.7%
Interquartile 25% (IQ1)44.7%40.2%
Interquartile 75% (IQ3)51.2%50.7%
Interquartile Range (IQR)6.6%10.5%
Standard Deviation (Sample)9.2%9.0%
Standard Deviation (Population)9.1%8.9%

Similar Demographics by Disability Age Over 75

Demographics Similar to Immigrants from Trinidad and Tobago by Disability Age Over 75

In terms of disability age over 75, the demographic groups most similar to Immigrants from Trinidad and Tobago are Immigrants from Lebanon (47.6%, a difference of 0.030%), Immigrants from Portugal (47.6%, a difference of 0.050%), Pakistani (47.7%, a difference of 0.060%), Immigrants from Ukraine (47.7%, a difference of 0.060%), and Immigrants from Jamaica (47.6%, a difference of 0.080%).
DemographicsRating | RankDisability Age Over 75
Basques
30.9
/100
|
#188
Fair
47.6%
Immigrants | Kenya
30.8
/100
|
#189
Fair
47.6%
Somalis
29.5
/100
|
#190
Fair
47.6%
Portuguese
29.3
/100
|
#191
Fair
47.6%
Immigrants | Jamaica
28.3
/100
|
#192
Fair
47.6%
Ottawa
28.1
/100
|
#193
Fair
47.6%
Immigrants | Lebanon
26.5
/100
|
#194
Fair
47.6%
Immigrants | Trinidad and Tobago
25.3
/100
|
#195
Fair
47.6%
Immigrants | Portugal
23.8
/100
|
#196
Fair
47.6%
Pakistanis
23.4
/100
|
#197
Fair
47.7%
Immigrants | Ukraine
23.2
/100
|
#198
Fair
47.7%
Immigrants | Eritrea
22.4
/100
|
#199
Fair
47.7%
Immigrants | Somalia
21.4
/100
|
#200
Fair
47.7%
Immigrants | Cuba
20.9
/100
|
#201
Fair
47.7%
Immigrants | Bahamas
20.7
/100
|
#202
Fair
47.7%

Demographics Similar to Immigrants from North Macedonia by Disability Age Over 75

In terms of disability age over 75, the demographic groups most similar to Immigrants from North Macedonia are Immigrants from Norway (45.9%, a difference of 0.0%), Austrian (46.0%, a difference of 0.030%), Immigrants from England (46.0%, a difference of 0.040%), Burmese (45.9%, a difference of 0.050%), and Immigrants from Spain (46.0%, a difference of 0.070%).
DemographicsRating | RankDisability Age Over 75
Immigrants | Turkey
99.6
/100
|
#57
Exceptional
45.9%
Immigrants | Israel
99.6
/100
|
#58
Exceptional
45.9%
Iranians
99.6
/100
|
#59
Exceptional
45.9%
Immigrants | Europe
99.6
/100
|
#60
Exceptional
45.9%
Immigrants | Argentina
99.6
/100
|
#61
Exceptional
45.9%
Burmese
99.5
/100
|
#62
Exceptional
45.9%
Immigrants | Norway
99.5
/100
|
#63
Exceptional
45.9%
Immigrants | North Macedonia
99.5
/100
|
#64
Exceptional
45.9%
Austrians
99.5
/100
|
#65
Exceptional
46.0%
Immigrants | England
99.5
/100
|
#66
Exceptional
46.0%
Immigrants | Spain
99.4
/100
|
#67
Exceptional
46.0%
Immigrants | South Central Asia
99.4
/100
|
#68
Exceptional
46.0%
Immigrants | Romania
99.3
/100
|
#69
Exceptional
46.0%
Jordanians
99.2
/100
|
#70
Exceptional
46.1%
Immigrants | Sri Lanka
99.2
/100
|
#71
Exceptional
46.1%