Immigrants from Thailand vs Japanese Disability Age 18 to 34
COMPARE
Immigrants from Thailand
Japanese
Disability Age 18 to 34
Disability Age 18 to 34 Comparison
Immigrants from Thailand
Japanese
6.9%
DISABILITY AGE 18 TO 34
7.5/ 100
METRIC RATING
215th/ 347
METRIC RANK
6.8%
DISABILITY AGE 18 TO 34
12.8/ 100
METRIC RATING
206th/ 347
METRIC RANK
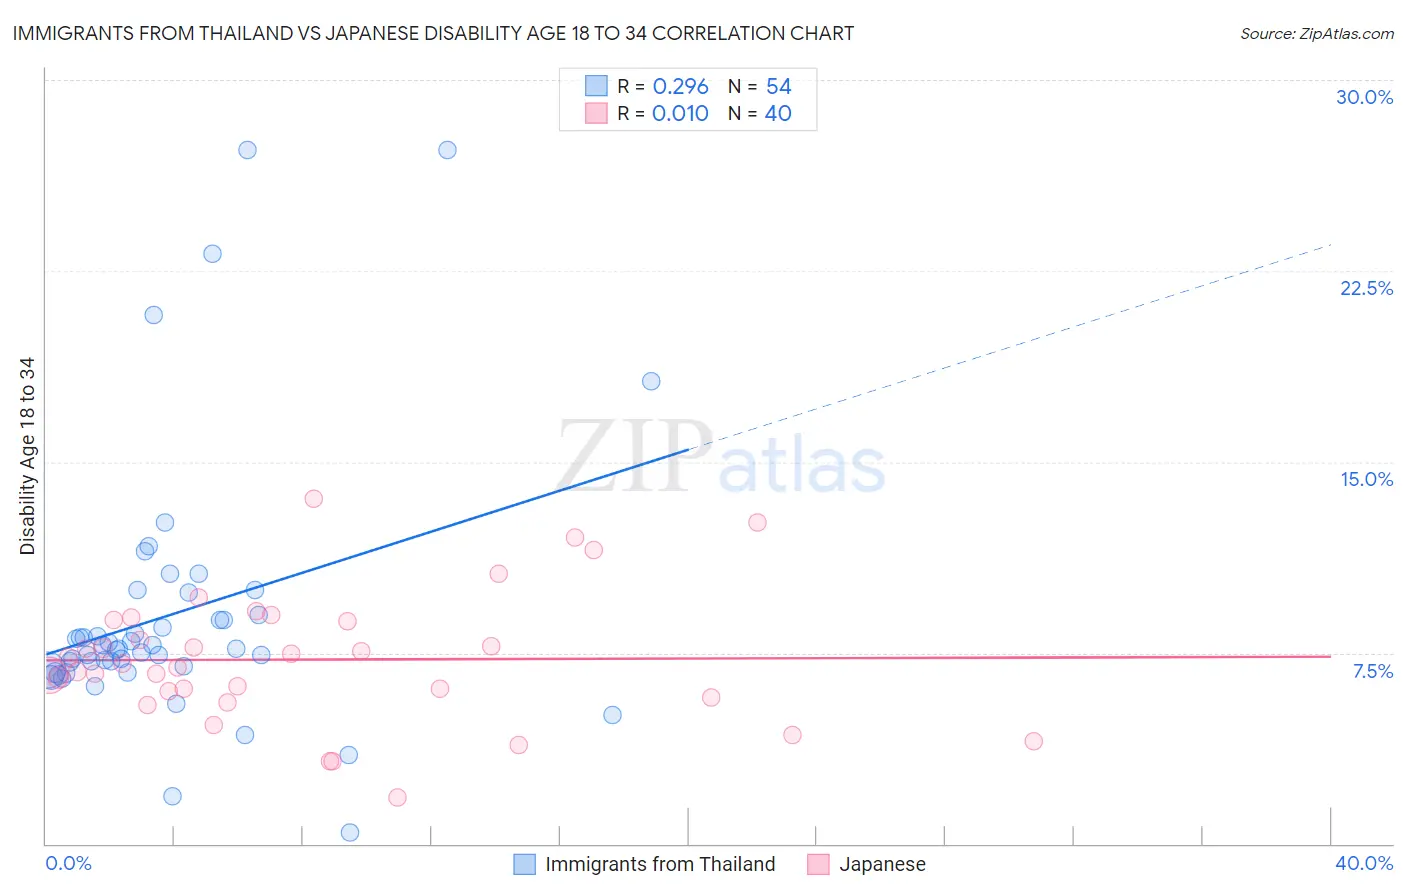
Immigrants from Thailand vs Japanese Disability Age 18 to 34 Correlation Chart
The statistical analysis conducted on geographies consisting of 316,632,491 people shows a weak positive correlation between the proportion of Immigrants from Thailand and percentage of population with a disability between the ages 18 and 35 in the United States with a correlation coefficient (R) of 0.296 and weighted average of 6.9%. Similarly, the statistical analysis conducted on geographies consisting of 248,950,888 people shows no correlation between the proportion of Japanese and percentage of population with a disability between the ages 18 and 35 in the United States with a correlation coefficient (R) of 0.010 and weighted average of 6.8%, a difference of 0.98%.
Disability Age 18 to 34 Correlation Summary
| Measurement | Immigrants from Thailand | Japanese |
| Minimum | 0.44% | 1.8% |
| Maximum | 27.3% | 13.6% |
| Range | 26.8% | 11.8% |
| Mean | 9.0% | 7.2% |
| Median | 7.7% | 7.0% |
| Interquartile 25% (IQ1) | 6.8% | 5.9% |
| Interquartile 75% (IQ3) | 9.0% | 8.8% |
| Interquartile Range (IQR) | 2.2% | 2.9% |
| Standard Deviation (Sample) | 5.2% | 2.6% |
| Standard Deviation (Population) | 5.1% | 2.5% |
Demographics Similar to Immigrants from Thailand and Japanese by Disability Age 18 to 34
In terms of disability age 18 to 34, the demographic groups most similar to Immigrants from Thailand are Sudanese (6.9%, a difference of 0.13%), Immigrants from Kenya (6.9%, a difference of 0.15%), Serbian (6.9%, a difference of 0.16%), Ukrainian (6.9%, a difference of 0.20%), and Hawaiian (6.9%, a difference of 0.27%). Similarly, the demographic groups most similar to Japanese are Mexican (6.8%, a difference of 0.030%), Immigrants from Scotland (6.8%, a difference of 0.050%), Lebanese (6.8%, a difference of 0.080%), Immigrants from Burma/Myanmar (6.8%, a difference of 0.080%), and Immigrants from Bosnia and Herzegovina (6.8%, a difference of 0.13%).
| Demographics | Rating | Rank | Disability Age 18 to 34 |
| Sierra Leoneans | 17.5 /100 | #200 | Poor 6.8% |
| Greeks | 16.1 /100 | #201 | Poor 6.8% |
| Panamanians | 15.8 /100 | #202 | Poor 6.8% |
| Hispanics or Latinos | 13.8 /100 | #203 | Poor 6.8% |
| Immigrants | Bosnia and Herzegovina | 13.6 /100 | #204 | Poor 6.8% |
| Lebanese | 13.3 /100 | #205 | Poor 6.8% |
| Japanese | 12.8 /100 | #206 | Poor 6.8% |
| Mexicans | 12.6 /100 | #207 | Poor 6.8% |
| Immigrants | Scotland | 12.4 /100 | #208 | Poor 6.8% |
| Immigrants | Burma/Myanmar | 12.3 /100 | #209 | Poor 6.8% |
| Latvians | 11.1 /100 | #210 | Poor 6.8% |
| Immigrants | Norway | 10.0 /100 | #211 | Tragic 6.8% |
| Luxembourgers | 9.4 /100 | #212 | Tragic 6.9% |
| Immigrants | Western Europe | 9.1 /100 | #213 | Tragic 6.9% |
| Serbians | 8.2 /100 | #214 | Tragic 6.9% |
| Immigrants | Thailand | 7.5 /100 | #215 | Tragic 6.9% |
| Sudanese | 7.0 /100 | #216 | Tragic 6.9% |
| Immigrants | Kenya | 6.9 /100 | #217 | Tragic 6.9% |
| Ukrainians | 6.7 /100 | #218 | Tragic 6.9% |
| Hawaiians | 6.5 /100 | #219 | Tragic 6.9% |
| Immigrants | Senegal | 5.5 /100 | #220 | Tragic 6.9% |