Immigrants from St. Vincent and the Grenadines vs Immigrants from China Disability Age 35 to 64
COMPARE
Immigrants from St. Vincent and the Grenadines
Immigrants from China
Disability Age 35 to 64
Disability Age 35 to 64 Comparison
Immigrants from St. Vincent and the Grenadines
Immigrants from China
11.1%
DISABILITY AGE 35 TO 64
66.6/ 100
METRIC RATING
163rd/ 347
METRIC RANK
8.7%
DISABILITY AGE 35 TO 64
100.0/ 100
METRIC RATING
9th/ 347
METRIC RANK
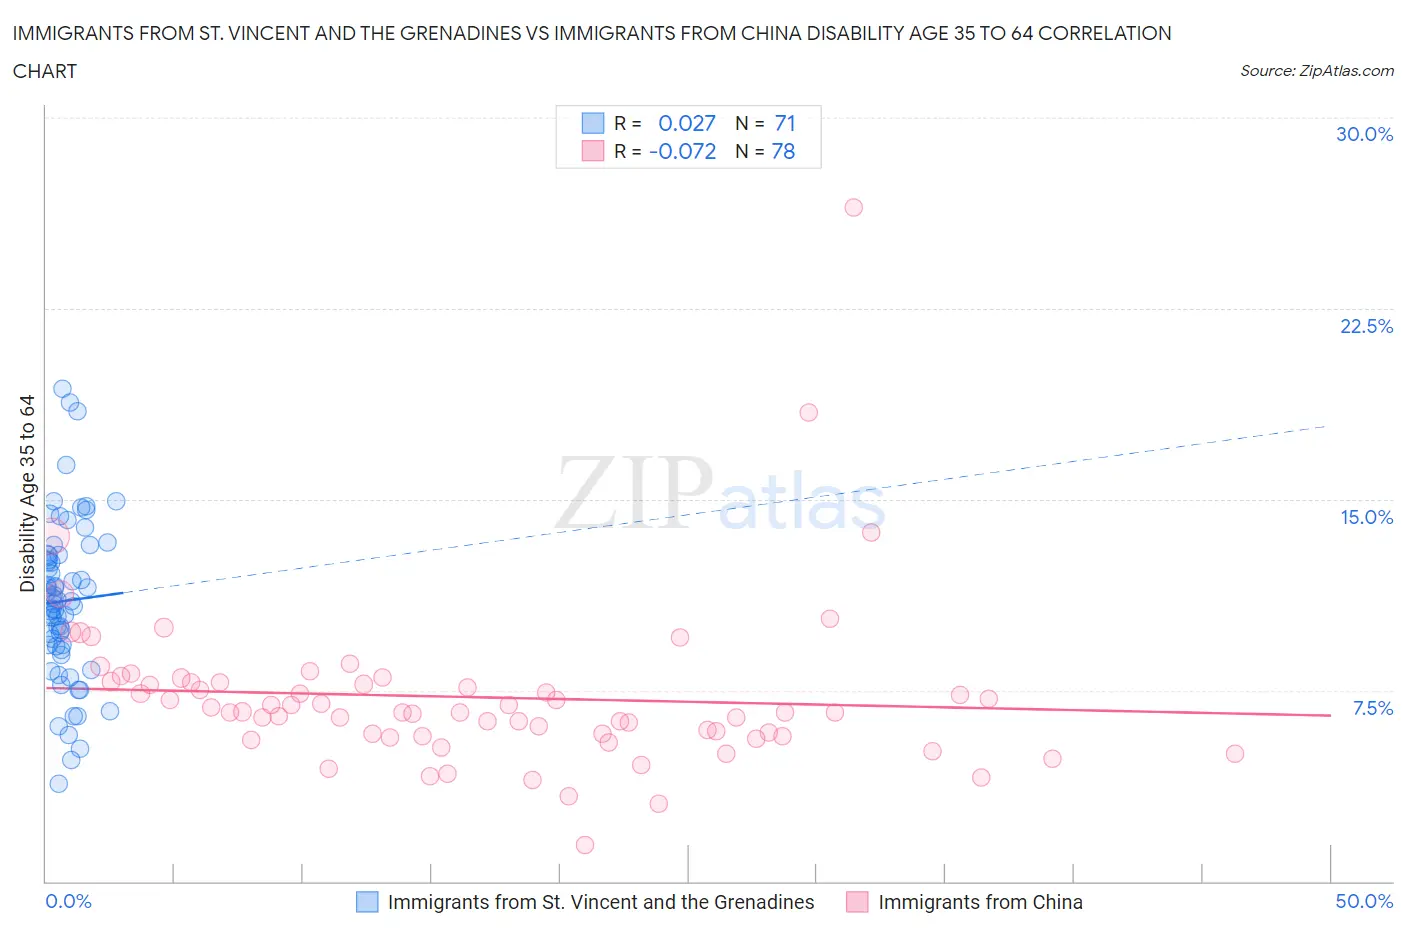
Immigrants from St. Vincent and the Grenadines vs Immigrants from China Disability Age 35 to 64 Correlation Chart
The statistical analysis conducted on geographies consisting of 56,186,452 people shows no correlation between the proportion of Immigrants from St. Vincent and the Grenadines and percentage of population with a disability between the ages 34 and 64 in the United States with a correlation coefficient (R) of 0.027 and weighted average of 11.1%. Similarly, the statistical analysis conducted on geographies consisting of 456,491,862 people shows a slight negative correlation between the proportion of Immigrants from China and percentage of population with a disability between the ages 34 and 64 in the United States with a correlation coefficient (R) of -0.072 and weighted average of 8.7%, a difference of 27.8%.
Disability Age 35 to 64 Correlation Summary
| Measurement | Immigrants from St. Vincent and the Grenadines | Immigrants from China |
| Minimum | 3.9% | 1.4% |
| Maximum | 19.3% | 26.5% |
| Range | 15.5% | 25.0% |
| Mean | 11.0% | 7.2% |
| Median | 11.0% | 6.6% |
| Interquartile 25% (IQ1) | 9.2% | 5.7% |
| Interquartile 75% (IQ3) | 12.8% | 7.8% |
| Interquartile Range (IQR) | 3.6% | 2.1% |
| Standard Deviation (Sample) | 3.1% | 3.3% |
| Standard Deviation (Population) | 3.1% | 3.2% |
Similar Demographics by Disability Age 35 to 64
Demographics Similar to Immigrants from St. Vincent and the Grenadines by Disability Age 35 to 64
In terms of disability age 35 to 64, the demographic groups most similar to Immigrants from St. Vincent and the Grenadines are Pakistani (11.1%, a difference of 0.080%), Immigrants from Western Europe (11.1%, a difference of 0.13%), Immigrants from Grenada (11.1%, a difference of 0.16%), Immigrants from Haiti (11.1%, a difference of 0.25%), and Austrian (11.1%, a difference of 0.30%).
| Demographics | Rating | Rank | Disability Age 35 to 64 |
| Immigrants | Sierra Leone | 76.2 /100 | #156 | Good 11.0% |
| Guyanese | 75.1 /100 | #157 | Good 11.0% |
| Immigrants | North America | 74.9 /100 | #158 | Good 11.0% |
| Serbians | 73.6 /100 | #159 | Good 11.0% |
| Croatians | 73.1 /100 | #160 | Good 11.0% |
| Immigrants | Guyana | 70.1 /100 | #161 | Good 11.1% |
| Immigrants | Grenada | 68.4 /100 | #162 | Good 11.1% |
| Immigrants | St. Vincent and the Grenadines | 66.6 /100 | #163 | Good 11.1% |
| Pakistanis | 65.8 /100 | #164 | Good 11.1% |
| Immigrants | Western Europe | 65.2 /100 | #165 | Good 11.1% |
| Immigrants | Haiti | 63.8 /100 | #166 | Good 11.1% |
| Austrians | 63.2 /100 | #167 | Good 11.1% |
| Central Americans | 59.1 /100 | #168 | Average 11.2% |
| Haitians | 59.0 /100 | #169 | Average 11.2% |
| Immigrants | Uganda | 58.0 /100 | #170 | Average 11.2% |
Demographics Similar to Immigrants from China by Disability Age 35 to 64
In terms of disability age 35 to 64, the demographic groups most similar to Immigrants from China are Immigrants from Bolivia (8.7%, a difference of 0.27%), Iranian (8.7%, a difference of 0.43%), Immigrants from Eastern Asia (8.8%, a difference of 0.97%), Immigrants from Israel (8.6%, a difference of 1.0%), and Thai (8.6%, a difference of 1.4%).
| Demographics | Rating | Rank | Disability Age 35 to 64 |
| Filipinos | 100.0 /100 | #2 | Exceptional 8.0% |
| Immigrants | Hong Kong | 100.0 /100 | #3 | Exceptional 8.2% |
| Immigrants | India | 100.0 /100 | #4 | Exceptional 8.3% |
| Immigrants | Iran | 100.0 /100 | #5 | Exceptional 8.5% |
| Thais | 100.0 /100 | #6 | Exceptional 8.6% |
| Immigrants | Israel | 100.0 /100 | #7 | Exceptional 8.6% |
| Iranians | 100.0 /100 | #8 | Exceptional 8.7% |
| Immigrants | China | 100.0 /100 | #9 | Exceptional 8.7% |
| Immigrants | Bolivia | 100.0 /100 | #10 | Exceptional 8.7% |
| Immigrants | Eastern Asia | 100.0 /100 | #11 | Exceptional 8.8% |
| Indians (Asian) | 100.0 /100 | #12 | Exceptional 8.9% |
| Immigrants | South Central Asia | 100.0 /100 | #13 | Exceptional 8.9% |
| Immigrants | Singapore | 100.0 /100 | #14 | Exceptional 8.9% |
| Bolivians | 100.0 /100 | #15 | Exceptional 8.9% |
| Immigrants | Korea | 100.0 /100 | #16 | Exceptional 9.0% |