Cajun vs Immigrants from China Disability Age 35 to 64
COMPARE
Cajun
Immigrants from China
Disability Age 35 to 64
Disability Age 35 to 64 Comparison
Cajuns
Immigrants from China
15.3%
DISABILITY AGE 35 TO 64
0.0/ 100
METRIC RATING
328th/ 347
METRIC RANK
8.7%
DISABILITY AGE 35 TO 64
100.0/ 100
METRIC RATING
9th/ 347
METRIC RANK
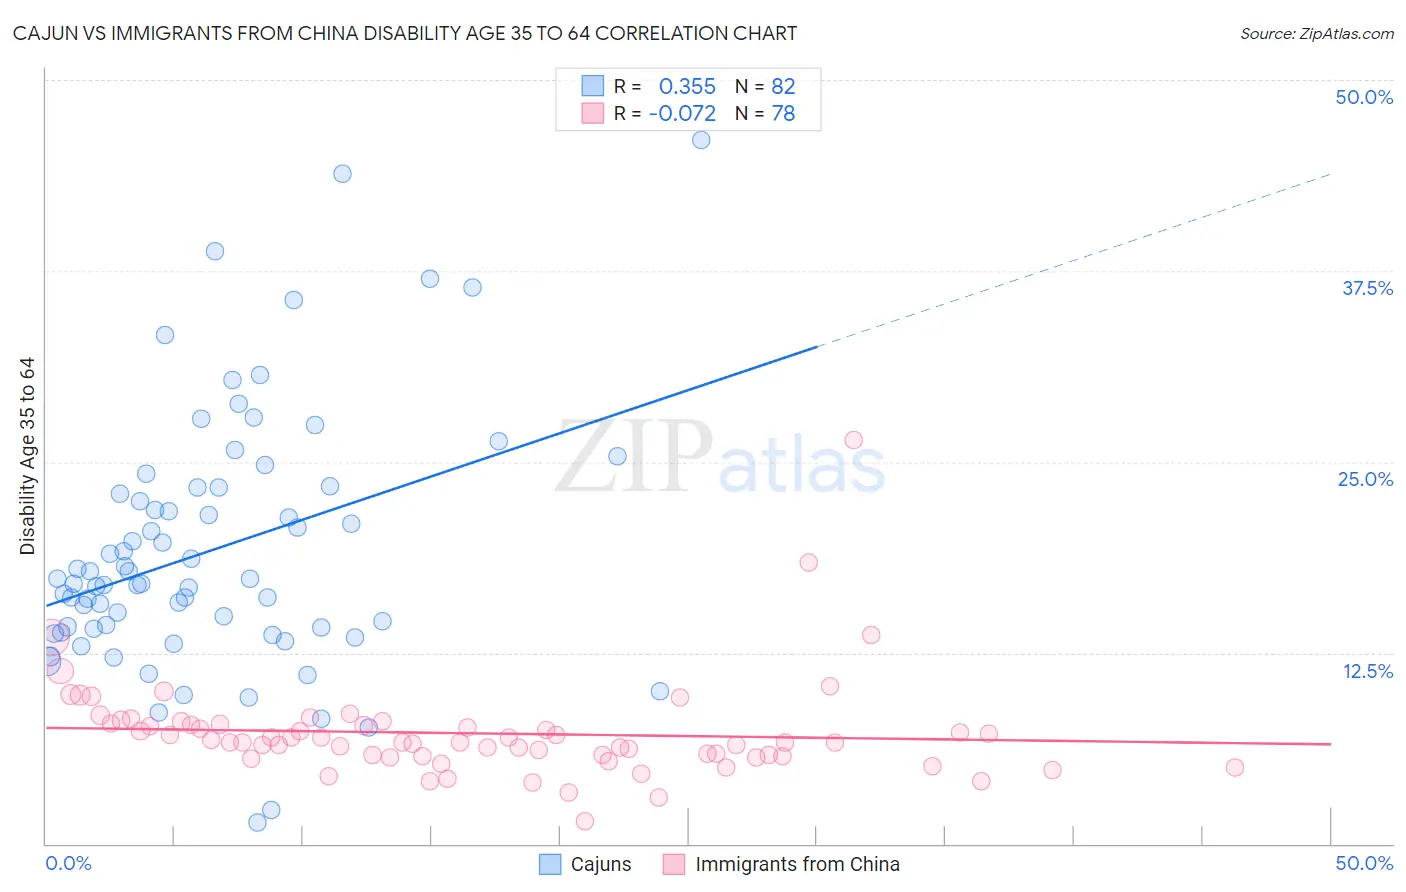
Cajun vs Immigrants from China Disability Age 35 to 64 Correlation Chart
The statistical analysis conducted on geographies consisting of 149,686,852 people shows a mild positive correlation between the proportion of Cajuns and percentage of population with a disability between the ages 34 and 64 in the United States with a correlation coefficient (R) of 0.355 and weighted average of 15.3%. Similarly, the statistical analysis conducted on geographies consisting of 456,491,862 people shows a slight negative correlation between the proportion of Immigrants from China and percentage of population with a disability between the ages 34 and 64 in the United States with a correlation coefficient (R) of -0.072 and weighted average of 8.7%, a difference of 76.3%.
Disability Age 35 to 64 Correlation Summary
| Measurement | Cajun | Immigrants from China |
| Minimum | 1.4% | 1.4% |
| Maximum | 46.1% | 26.5% |
| Range | 44.7% | 25.0% |
| Mean | 19.2% | 7.2% |
| Median | 17.2% | 6.6% |
| Interquartile 25% (IQ1) | 14.1% | 5.7% |
| Interquartile 75% (IQ3) | 23.3% | 7.8% |
| Interquartile Range (IQR) | 9.2% | 2.1% |
| Standard Deviation (Sample) | 8.4% | 3.3% |
| Standard Deviation (Population) | 8.3% | 3.2% |
Similar Demographics by Disability Age 35 to 64
Demographics Similar to Cajuns by Disability Age 35 to 64
In terms of disability age 35 to 64, the demographic groups most similar to Cajuns are Pueblo (15.3%, a difference of 0.18%), Native/Alaskan (15.3%, a difference of 0.20%), Cherokee (15.5%, a difference of 0.75%), Navajo (15.5%, a difference of 0.96%), and Arapaho (15.1%, a difference of 1.8%).
| Demographics | Rating | Rank | Disability Age 35 to 64 |
| Comanche | 0.0 /100 | #321 | Tragic 14.7% |
| Potawatomi | 0.0 /100 | #322 | Tragic 14.8% |
| Apache | 0.0 /100 | #323 | Tragic 14.9% |
| Chippewa | 0.0 /100 | #324 | Tragic 15.0% |
| Arapaho | 0.0 /100 | #325 | Tragic 15.1% |
| Natives/Alaskans | 0.0 /100 | #326 | Tragic 15.3% |
| Pueblo | 0.0 /100 | #327 | Tragic 15.3% |
| Cajuns | 0.0 /100 | #328 | Tragic 15.3% |
| Cherokee | 0.0 /100 | #329 | Tragic 15.5% |
| Navajo | 0.0 /100 | #330 | Tragic 15.5% |
| Dutch West Indians | 0.0 /100 | #331 | Tragic 15.6% |
| Alaskan Athabascans | 0.0 /100 | #332 | Tragic 15.7% |
| Yuman | 0.0 /100 | #333 | Tragic 15.8% |
| Colville | 0.0 /100 | #334 | Tragic 15.8% |
| Seminole | 0.0 /100 | #335 | Tragic 15.9% |
Demographics Similar to Immigrants from China by Disability Age 35 to 64
In terms of disability age 35 to 64, the demographic groups most similar to Immigrants from China are Immigrants from Bolivia (8.7%, a difference of 0.27%), Iranian (8.7%, a difference of 0.43%), Immigrants from Eastern Asia (8.8%, a difference of 0.97%), Immigrants from Israel (8.6%, a difference of 1.0%), and Thai (8.6%, a difference of 1.4%).
| Demographics | Rating | Rank | Disability Age 35 to 64 |
| Filipinos | 100.0 /100 | #2 | Exceptional 8.0% |
| Immigrants | Hong Kong | 100.0 /100 | #3 | Exceptional 8.2% |
| Immigrants | India | 100.0 /100 | #4 | Exceptional 8.3% |
| Immigrants | Iran | 100.0 /100 | #5 | Exceptional 8.5% |
| Thais | 100.0 /100 | #6 | Exceptional 8.6% |
| Immigrants | Israel | 100.0 /100 | #7 | Exceptional 8.6% |
| Iranians | 100.0 /100 | #8 | Exceptional 8.7% |
| Immigrants | China | 100.0 /100 | #9 | Exceptional 8.7% |
| Immigrants | Bolivia | 100.0 /100 | #10 | Exceptional 8.7% |
| Immigrants | Eastern Asia | 100.0 /100 | #11 | Exceptional 8.8% |
| Indians (Asian) | 100.0 /100 | #12 | Exceptional 8.9% |
| Immigrants | South Central Asia | 100.0 /100 | #13 | Exceptional 8.9% |
| Immigrants | Singapore | 100.0 /100 | #14 | Exceptional 8.9% |
| Bolivians | 100.0 /100 | #15 | Exceptional 8.9% |
| Immigrants | Korea | 100.0 /100 | #16 | Exceptional 9.0% |