Immigrants from St. Vincent and the Grenadines vs Bulgarian Disability Age 35 to 64
COMPARE
Immigrants from St. Vincent and the Grenadines
Bulgarian
Disability Age 35 to 64
Disability Age 35 to 64 Comparison
Immigrants from St. Vincent and the Grenadines
Bulgarians
11.1%
DISABILITY AGE 35 TO 64
66.6/ 100
METRIC RATING
163rd/ 347
METRIC RANK
9.7%
DISABILITY AGE 35 TO 64
99.9/ 100
METRIC RATING
35th/ 347
METRIC RANK
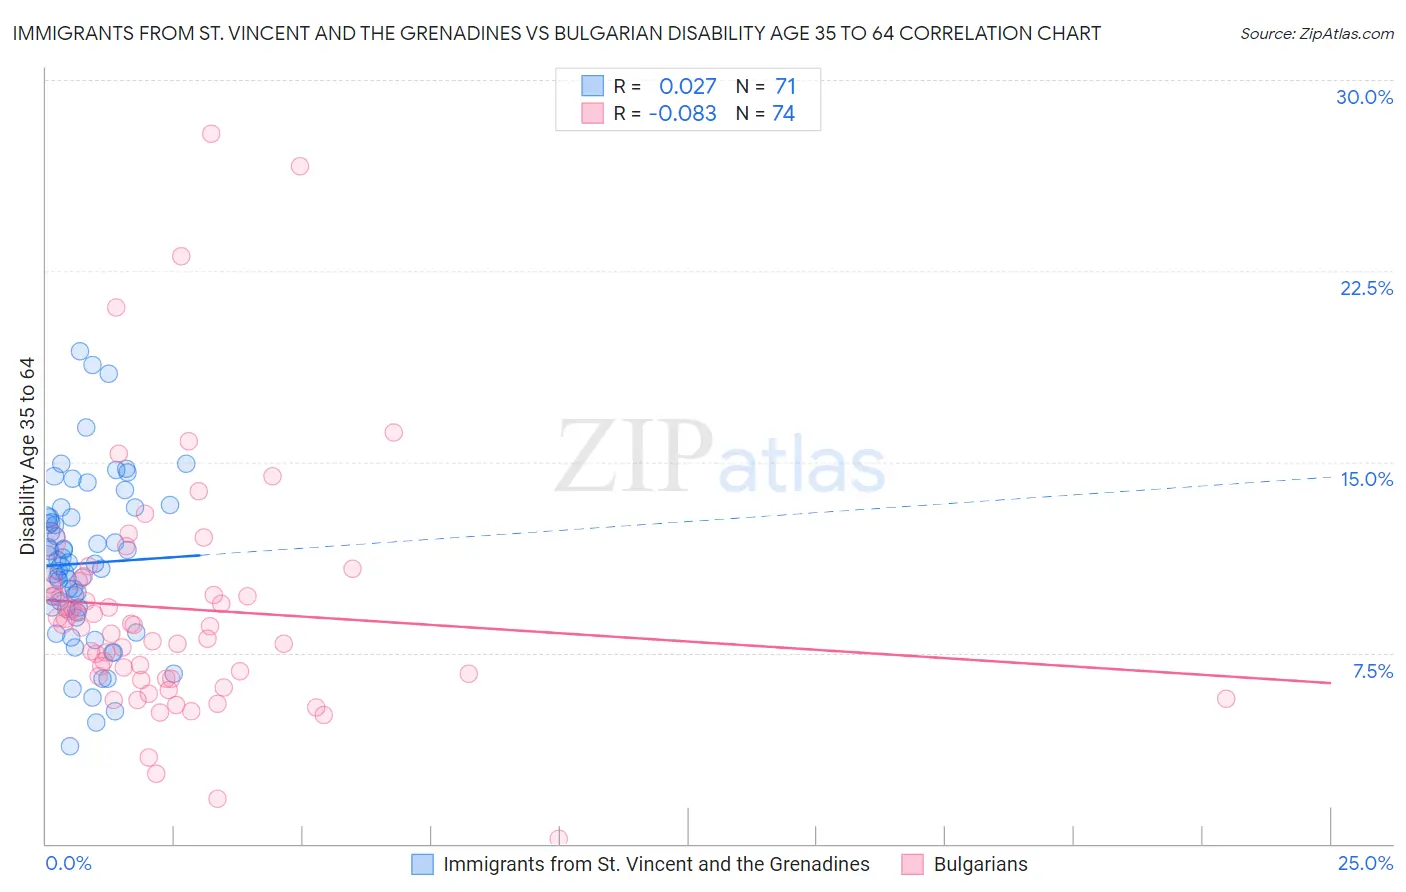
Immigrants from St. Vincent and the Grenadines vs Bulgarian Disability Age 35 to 64 Correlation Chart
The statistical analysis conducted on geographies consisting of 56,186,452 people shows no correlation between the proportion of Immigrants from St. Vincent and the Grenadines and percentage of population with a disability between the ages 34 and 64 in the United States with a correlation coefficient (R) of 0.027 and weighted average of 11.1%. Similarly, the statistical analysis conducted on geographies consisting of 205,563,326 people shows a slight negative correlation between the proportion of Bulgarians and percentage of population with a disability between the ages 34 and 64 in the United States with a correlation coefficient (R) of -0.083 and weighted average of 9.7%, a difference of 14.9%.
Disability Age 35 to 64 Correlation Summary
| Measurement | Immigrants from St. Vincent and the Grenadines | Bulgarian |
| Minimum | 3.9% | 0.21% |
| Maximum | 19.3% | 27.9% |
| Range | 15.5% | 27.7% |
| Mean | 11.0% | 9.2% |
| Median | 11.0% | 8.6% |
| Interquartile 25% (IQ1) | 9.2% | 6.5% |
| Interquartile 75% (IQ3) | 12.8% | 10.3% |
| Interquartile Range (IQR) | 3.6% | 3.8% |
| Standard Deviation (Sample) | 3.1% | 4.8% |
| Standard Deviation (Population) | 3.1% | 4.8% |
Similar Demographics by Disability Age 35 to 64
Demographics Similar to Immigrants from St. Vincent and the Grenadines by Disability Age 35 to 64
In terms of disability age 35 to 64, the demographic groups most similar to Immigrants from St. Vincent and the Grenadines are Pakistani (11.1%, a difference of 0.080%), Immigrants from Western Europe (11.1%, a difference of 0.13%), Immigrants from Grenada (11.1%, a difference of 0.16%), Immigrants from Haiti (11.1%, a difference of 0.25%), and Austrian (11.1%, a difference of 0.30%).
| Demographics | Rating | Rank | Disability Age 35 to 64 |
| Immigrants | Sierra Leone | 76.2 /100 | #156 | Good 11.0% |
| Guyanese | 75.1 /100 | #157 | Good 11.0% |
| Immigrants | North America | 74.9 /100 | #158 | Good 11.0% |
| Serbians | 73.6 /100 | #159 | Good 11.0% |
| Croatians | 73.1 /100 | #160 | Good 11.0% |
| Immigrants | Guyana | 70.1 /100 | #161 | Good 11.1% |
| Immigrants | Grenada | 68.4 /100 | #162 | Good 11.1% |
| Immigrants | St. Vincent and the Grenadines | 66.6 /100 | #163 | Good 11.1% |
| Pakistanis | 65.8 /100 | #164 | Good 11.1% |
| Immigrants | Western Europe | 65.2 /100 | #165 | Good 11.1% |
| Immigrants | Haiti | 63.8 /100 | #166 | Good 11.1% |
| Austrians | 63.2 /100 | #167 | Good 11.1% |
| Central Americans | 59.1 /100 | #168 | Average 11.2% |
| Haitians | 59.0 /100 | #169 | Average 11.2% |
| Immigrants | Uganda | 58.0 /100 | #170 | Average 11.2% |
Demographics Similar to Bulgarians by Disability Age 35 to 64
In terms of disability age 35 to 64, the demographic groups most similar to Bulgarians are Immigrants from Cuba (9.7%, a difference of 0.040%), Immigrants from Australia (9.7%, a difference of 0.10%), Immigrants from Turkey (9.7%, a difference of 0.11%), Immigrants from Indonesia (9.7%, a difference of 0.17%), and Egyptian (9.7%, a difference of 0.18%).
| Demographics | Rating | Rank | Disability Age 35 to 64 |
| Immigrants | Pakistan | 100.0 /100 | #28 | Exceptional 9.5% |
| Immigrants | Ireland | 100.0 /100 | #29 | Exceptional 9.5% |
| Immigrants | Japan | 100.0 /100 | #30 | Exceptional 9.5% |
| Immigrants | Lithuania | 99.9 /100 | #31 | Exceptional 9.6% |
| Turks | 99.9 /100 | #32 | Exceptional 9.7% |
| Immigrants | Indonesia | 99.9 /100 | #33 | Exceptional 9.7% |
| Immigrants | Australia | 99.9 /100 | #34 | Exceptional 9.7% |
| Bulgarians | 99.9 /100 | #35 | Exceptional 9.7% |
| Immigrants | Cuba | 99.9 /100 | #36 | Exceptional 9.7% |
| Immigrants | Turkey | 99.9 /100 | #37 | Exceptional 9.7% |
| Egyptians | 99.9 /100 | #38 | Exceptional 9.7% |
| Immigrants | Belarus | 99.9 /100 | #39 | Exceptional 9.7% |
| Immigrants | Armenia | 99.9 /100 | #40 | Exceptional 9.7% |
| Israelis | 99.9 /100 | #41 | Exceptional 9.7% |
| Immigrants | Malaysia | 99.9 /100 | #42 | Exceptional 9.7% |