Burmese vs Immigrants from Southern Europe Cognitive Disability
COMPARE
Burmese
Immigrants from Southern Europe
Cognitive Disability
Cognitive Disability Comparison
Burmese
Immigrants from Southern Europe
16.7%
COGNITIVE DISABILITY
99.3/ 100
METRIC RATING
73rd/ 347
METRIC RANK
16.7%
COGNITIVE DISABILITY
98.7/ 100
METRIC RATING
93rd/ 347
METRIC RANK
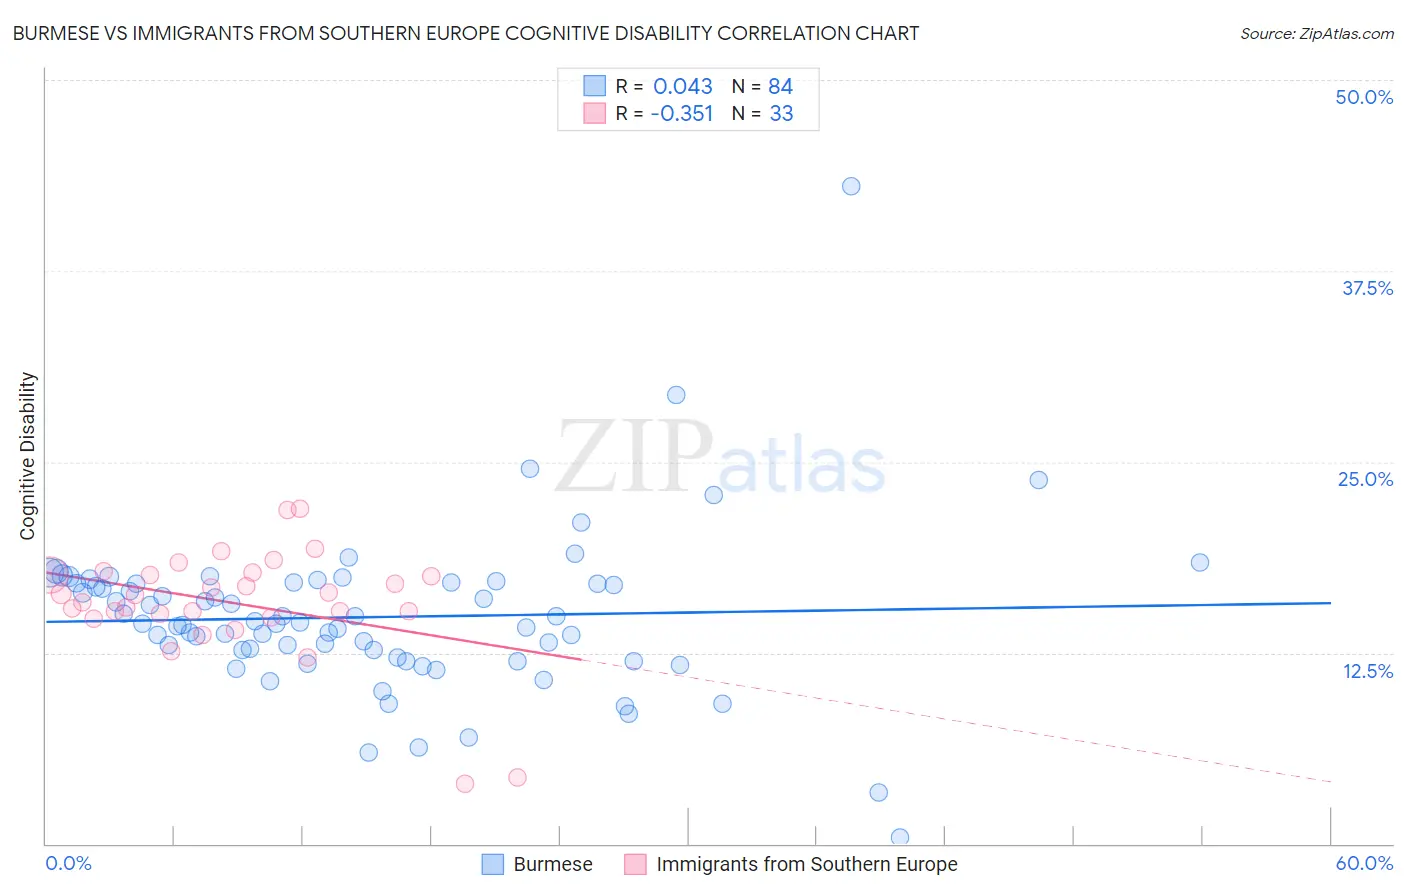
Burmese vs Immigrants from Southern Europe Cognitive Disability Correlation Chart
The statistical analysis conducted on geographies consisting of 465,327,059 people shows no correlation between the proportion of Burmese and percentage of population with cognitive disability in the United States with a correlation coefficient (R) of 0.043 and weighted average of 16.7%. Similarly, the statistical analysis conducted on geographies consisting of 402,774,065 people shows a mild negative correlation between the proportion of Immigrants from Southern Europe and percentage of population with cognitive disability in the United States with a correlation coefficient (R) of -0.351 and weighted average of 16.7%, a difference of 0.46%.
Cognitive Disability Correlation Summary
| Measurement | Burmese | Immigrants from Southern Europe |
| Minimum | 0.40% | 3.9% |
| Maximum | 43.0% | 21.9% |
| Range | 42.6% | 18.0% |
| Mean | 14.8% | 15.8% |
| Median | 14.4% | 16.3% |
| Interquartile 25% (IQ1) | 12.4% | 14.9% |
| Interquartile 75% (IQ3) | 17.1% | 17.7% |
| Interquartile Range (IQR) | 4.7% | 2.8% |
| Standard Deviation (Sample) | 5.3% | 3.7% |
| Standard Deviation (Population) | 5.3% | 3.7% |
Demographics Similar to Burmese and Immigrants from Southern Europe by Cognitive Disability
In terms of cognitive disability, the demographic groups most similar to Burmese are Slavic (16.7%, a difference of 0.0%), Estonian (16.7%, a difference of 0.010%), Immigrants from Serbia (16.7%, a difference of 0.030%), Immigrants from Hungary (16.7%, a difference of 0.040%), and Peruvian (16.7%, a difference of 0.040%). Similarly, the demographic groups most similar to Immigrants from Southern Europe are Immigrants from South America (16.7%, a difference of 0.0%), Immigrants from Egypt (16.7%, a difference of 0.020%), South American (16.7%, a difference of 0.020%), Danish (16.7%, a difference of 0.020%), and Immigrants from Philippines (16.7%, a difference of 0.13%).
| Demographics | Rating | Rank | Cognitive Disability |
| Burmese | 99.3 /100 | #73 | Exceptional 16.7% |
| Slavs | 99.3 /100 | #74 | Exceptional 16.7% |
| Estonians | 99.3 /100 | #75 | Exceptional 16.7% |
| Immigrants | Serbia | 99.3 /100 | #76 | Exceptional 16.7% |
| Immigrants | Hungary | 99.3 /100 | #77 | Exceptional 16.7% |
| Peruvians | 99.3 /100 | #78 | Exceptional 16.7% |
| Immigrants | Bulgaria | 99.3 /100 | #79 | Exceptional 16.7% |
| Egyptians | 99.2 /100 | #80 | Exceptional 16.7% |
| Immigrants | Netherlands | 99.2 /100 | #81 | Exceptional 16.7% |
| Swiss | 99.2 /100 | #82 | Exceptional 16.7% |
| Serbians | 99.1 /100 | #83 | Exceptional 16.7% |
| Belgians | 99.1 /100 | #84 | Exceptional 16.7% |
| Immigrants | Moldova | 99.1 /100 | #85 | Exceptional 16.7% |
| Immigrants | South Africa | 99.0 /100 | #86 | Exceptional 16.7% |
| Native Hawaiians | 99.0 /100 | #87 | Exceptional 16.7% |
| Immigrants | Philippines | 99.0 /100 | #88 | Exceptional 16.7% |
| Immigrants | Egypt | 98.8 /100 | #89 | Exceptional 16.7% |
| South Americans | 98.8 /100 | #90 | Exceptional 16.7% |
| Danes | 98.8 /100 | #91 | Exceptional 16.7% |
| Immigrants | South America | 98.8 /100 | #92 | Exceptional 16.7% |
| Immigrants | Southern Europe | 98.7 /100 | #93 | Exceptional 16.7% |