Immigrants from Southern Europe vs Immigrants from Malaysia Female Disability
COMPARE
Immigrants from Southern Europe
Immigrants from Malaysia
Female Disability
Female Disability Comparison
Immigrants from Southern Europe
Immigrants from Malaysia
12.2%
FEMALE DISABILITY
56.3/ 100
METRIC RATING
171st/ 347
METRIC RANK
11.1%
FEMALE DISABILITY
100.0/ 100
METRIC RATING
29th/ 347
METRIC RANK
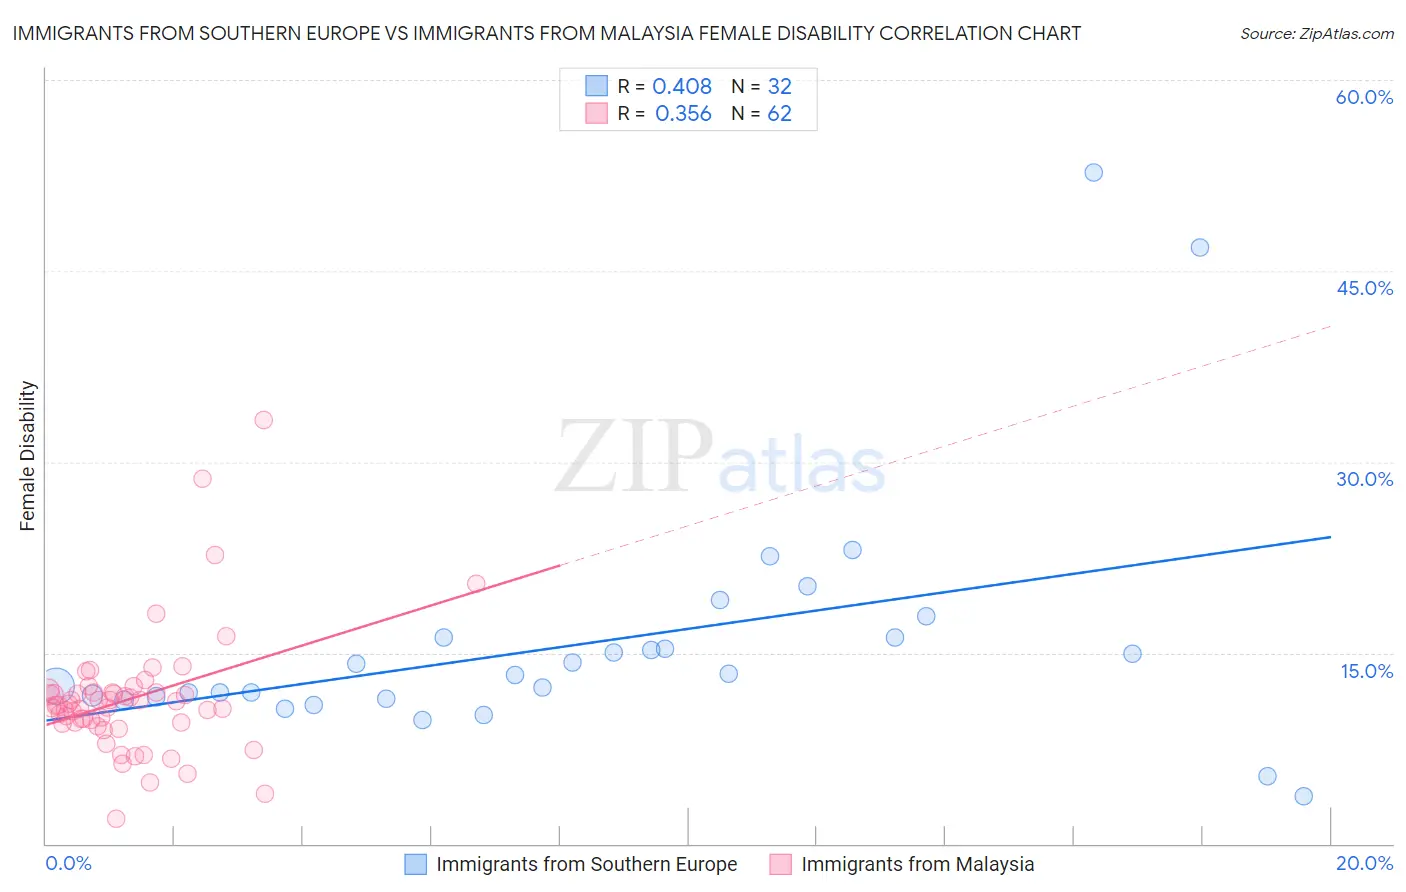
Immigrants from Southern Europe vs Immigrants from Malaysia Female Disability Correlation Chart
The statistical analysis conducted on geographies consisting of 402,770,343 people shows a moderate positive correlation between the proportion of Immigrants from Southern Europe and percentage of females with a disability in the United States with a correlation coefficient (R) of 0.408 and weighted average of 12.2%. Similarly, the statistical analysis conducted on geographies consisting of 197,971,207 people shows a mild positive correlation between the proportion of Immigrants from Malaysia and percentage of females with a disability in the United States with a correlation coefficient (R) of 0.356 and weighted average of 11.1%, a difference of 9.6%.
Female Disability Correlation Summary
| Measurement | Immigrants from Southern Europe | Immigrants from Malaysia |
| Minimum | 3.7% | 1.9% |
| Maximum | 52.8% | 33.3% |
| Range | 49.1% | 31.4% |
| Mean | 15.8% | 11.4% |
| Median | 13.3% | 10.9% |
| Interquartile 25% (IQ1) | 11.5% | 9.5% |
| Interquartile 75% (IQ3) | 16.2% | 11.8% |
| Interquartile Range (IQR) | 4.7% | 2.3% |
| Standard Deviation (Sample) | 9.8% | 4.9% |
| Standard Deviation (Population) | 9.7% | 4.9% |
Similar Demographics by Female Disability
Demographics Similar to Immigrants from Southern Europe by Female Disability
In terms of female disability, the demographic groups most similar to Immigrants from Southern Europe are Maltese (12.2%, a difference of 0.030%), Lebanese (12.2%, a difference of 0.070%), Immigrants from Haiti (12.2%, a difference of 0.10%), Immigrants from Latin America (12.2%, a difference of 0.11%), and Lithuanian (12.2%, a difference of 0.12%).
| Demographics | Rating | Rank | Female Disability |
| Czechs | 63.6 /100 | #164 | Good 12.1% |
| Immigrants | Oceania | 61.8 /100 | #165 | Good 12.1% |
| Lithuanians | 59.5 /100 | #166 | Average 12.2% |
| Immigrants | Latin America | 59.0 /100 | #167 | Average 12.2% |
| Immigrants | Haiti | 58.8 /100 | #168 | Average 12.2% |
| Lebanese | 58.1 /100 | #169 | Average 12.2% |
| Maltese | 57.0 /100 | #170 | Average 12.2% |
| Immigrants | Southern Europe | 56.3 /100 | #171 | Average 12.2% |
| Haitians | 51.9 /100 | #172 | Average 12.2% |
| Immigrants | Mexico | 50.8 /100 | #173 | Average 12.2% |
| Immigrants | England | 50.0 /100 | #174 | Average 12.2% |
| Immigrants | St. Vincent and the Grenadines | 49.7 /100 | #175 | Average 12.2% |
| Immigrants | Guyana | 43.1 /100 | #176 | Average 12.2% |
| Immigrants | Ghana | 42.5 /100 | #177 | Average 12.2% |
| Immigrants | Western Europe | 40.9 /100 | #178 | Average 12.2% |
Demographics Similar to Immigrants from Malaysia by Female Disability
In terms of female disability, the demographic groups most similar to Immigrants from Malaysia are Turkish (11.1%, a difference of 0.0%), Egyptian (11.1%, a difference of 0.060%), Immigrants from Kuwait (11.1%, a difference of 0.10%), Immigrants from Australia (11.1%, a difference of 0.27%), and Immigrants from Turkey (11.1%, a difference of 0.34%).
| Demographics | Rating | Rank | Female Disability |
| Immigrants | Sri Lanka | 100.0 /100 | #22 | Exceptional 10.9% |
| Venezuelans | 100.0 /100 | #23 | Exceptional 11.0% |
| Immigrants | Argentina | 100.0 /100 | #24 | Exceptional 11.0% |
| Immigrants | Asia | 100.0 /100 | #25 | Exceptional 11.0% |
| Argentineans | 100.0 /100 | #26 | Exceptional 11.0% |
| Immigrants | Turkey | 100.0 /100 | #27 | Exceptional 11.1% |
| Egyptians | 100.0 /100 | #28 | Exceptional 11.1% |
| Immigrants | Malaysia | 100.0 /100 | #29 | Exceptional 11.1% |
| Turks | 100.0 /100 | #30 | Exceptional 11.1% |
| Immigrants | Kuwait | 100.0 /100 | #31 | Exceptional 11.1% |
| Immigrants | Australia | 100.0 /100 | #32 | Exceptional 11.1% |
| Immigrants | Egypt | 100.0 /100 | #33 | Exceptional 11.1% |
| Immigrants | Indonesia | 100.0 /100 | #34 | Exceptional 11.2% |
| Immigrants | Japan | 100.0 /100 | #35 | Exceptional 11.2% |
| Cypriots | 100.0 /100 | #36 | Exceptional 11.2% |