Sioux vs Filipino Disability Age Over 75
COMPARE
Sioux
Filipino
Disability Age Over 75
Disability Age Over 75 Comparison
Sioux
Filipinos
49.7%
DISABILITY AGE OVER 75
0.0/ 100
METRIC RATING
287th/ 347
METRIC RANK
45.4%
DISABILITY AGE OVER 75
99.9/ 100
METRIC RATING
29th/ 347
METRIC RANK
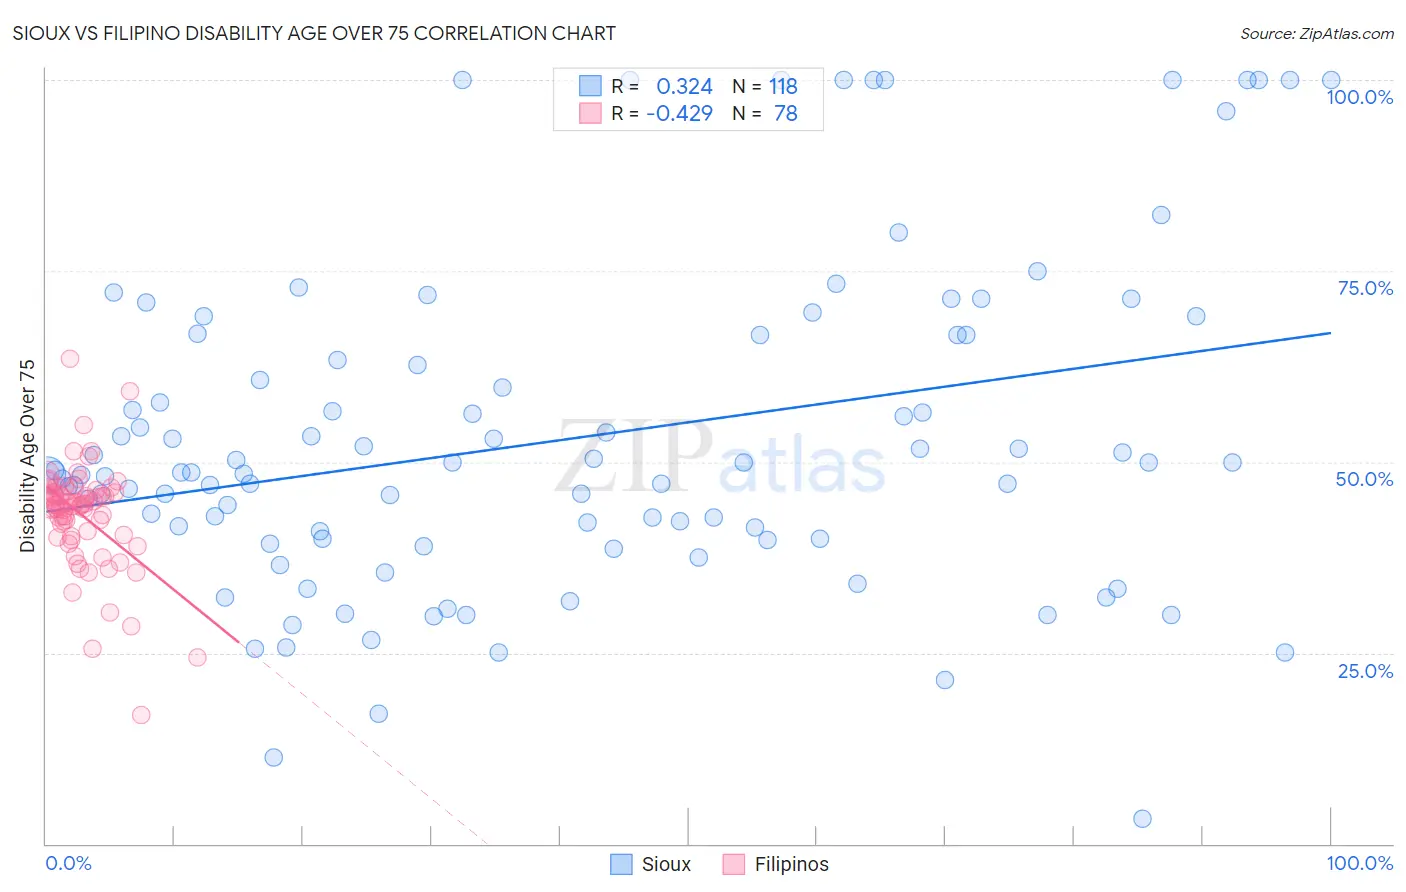
Sioux vs Filipino Disability Age Over 75 Correlation Chart
The statistical analysis conducted on geographies consisting of 233,802,290 people shows a mild positive correlation between the proportion of Sioux and percentage of population with a disability over the age of 75 in the United States with a correlation coefficient (R) of 0.324 and weighted average of 49.7%. Similarly, the statistical analysis conducted on geographies consisting of 253,957,149 people shows a moderate negative correlation between the proportion of Filipinos and percentage of population with a disability over the age of 75 in the United States with a correlation coefficient (R) of -0.429 and weighted average of 45.4%, a difference of 9.5%.
Disability Age Over 75 Correlation Summary
| Measurement | Sioux | Filipino |
| Minimum | 3.3% | 16.9% |
| Maximum | 100.0% | 63.6% |
| Range | 96.7% | 46.6% |
| Mean | 53.0% | 43.1% |
| Median | 48.6% | 44.4% |
| Interquartile 25% (IQ1) | 40.0% | 40.4% |
| Interquartile 75% (IQ3) | 66.7% | 45.9% |
| Interquartile Range (IQR) | 26.7% | 5.5% |
| Standard Deviation (Sample) | 21.3% | 6.8% |
| Standard Deviation (Population) | 21.2% | 6.8% |
Similar Demographics by Disability Age Over 75
Demographics Similar to Sioux by Disability Age Over 75
In terms of disability age over 75, the demographic groups most similar to Sioux are Yaqui (49.8%, a difference of 0.050%), Osage (49.8%, a difference of 0.13%), Puget Sound Salish (49.8%, a difference of 0.14%), Arapaho (49.8%, a difference of 0.14%), and Immigrants from Belize (49.6%, a difference of 0.21%).
| Demographics | Rating | Rank | Disability Age Over 75 |
| Bangladeshis | 0.0 /100 | #280 | Tragic 49.4% |
| Belizeans | 0.0 /100 | #281 | Tragic 49.4% |
| Blacks/African Americans | 0.0 /100 | #282 | Tragic 49.5% |
| Samoans | 0.0 /100 | #283 | Tragic 49.5% |
| Immigrants | Latin America | 0.0 /100 | #284 | Tragic 49.5% |
| Crow | 0.0 /100 | #285 | Tragic 49.6% |
| Immigrants | Belize | 0.0 /100 | #286 | Tragic 49.6% |
| Sioux | 0.0 /100 | #287 | Tragic 49.7% |
| Yaqui | 0.0 /100 | #288 | Tragic 49.8% |
| Osage | 0.0 /100 | #289 | Tragic 49.8% |
| Puget Sound Salish | 0.0 /100 | #290 | Tragic 49.8% |
| Arapaho | 0.0 /100 | #291 | Tragic 49.8% |
| Shoshone | 0.0 /100 | #292 | Tragic 49.9% |
| Spanish American Indians | 0.0 /100 | #293 | Tragic 49.9% |
| Immigrants | Cambodia | 0.0 /100 | #294 | Tragic 50.0% |
Demographics Similar to Filipinos by Disability Age Over 75
In terms of disability age over 75, the demographic groups most similar to Filipinos are Immigrants from Denmark (45.4%, a difference of 0.030%), Thai (45.4%, a difference of 0.040%), Immigrants from Poland (45.4%, a difference of 0.060%), Macedonian (45.4%, a difference of 0.080%), and Immigrants from Bulgaria (45.5%, a difference of 0.090%).
| Demographics | Rating | Rank | Disability Age Over 75 |
| Immigrants | South Africa | 100.0 /100 | #22 | Exceptional 45.3% |
| Immigrants | Switzerland | 99.9 /100 | #23 | Exceptional 45.3% |
| Poles | 99.9 /100 | #24 | Exceptional 45.3% |
| Immigrants | Bolivia | 99.9 /100 | #25 | Exceptional 45.4% |
| Macedonians | 99.9 /100 | #26 | Exceptional 45.4% |
| Immigrants | Poland | 99.9 /100 | #27 | Exceptional 45.4% |
| Thais | 99.9 /100 | #28 | Exceptional 45.4% |
| Filipinos | 99.9 /100 | #29 | Exceptional 45.4% |
| Immigrants | Denmark | 99.9 /100 | #30 | Exceptional 45.4% |
| Immigrants | Bulgaria | 99.9 /100 | #31 | Exceptional 45.5% |
| Immigrants | Australia | 99.9 /100 | #32 | Exceptional 45.5% |
| Immigrants | Croatia | 99.9 /100 | #33 | Exceptional 45.5% |
| Russians | 99.9 /100 | #34 | Exceptional 45.5% |
| Norwegians | 99.9 /100 | #35 | Exceptional 45.5% |
| Immigrants | Taiwan | 99.9 /100 | #36 | Exceptional 45.5% |