Immigrants from South Africa vs Immigrants from Syria Disability Age 35 to 64
COMPARE
Immigrants from South Africa
Immigrants from Syria
Disability Age 35 to 64
Disability Age 35 to 64 Comparison
Immigrants from South Africa
Immigrants from Syria
10.3%
DISABILITY AGE 35 TO 64
98.5/ 100
METRIC RATING
96th/ 347
METRIC RANK
10.7%
DISABILITY AGE 35 TO 64
93.0/ 100
METRIC RATING
130th/ 347
METRIC RANK
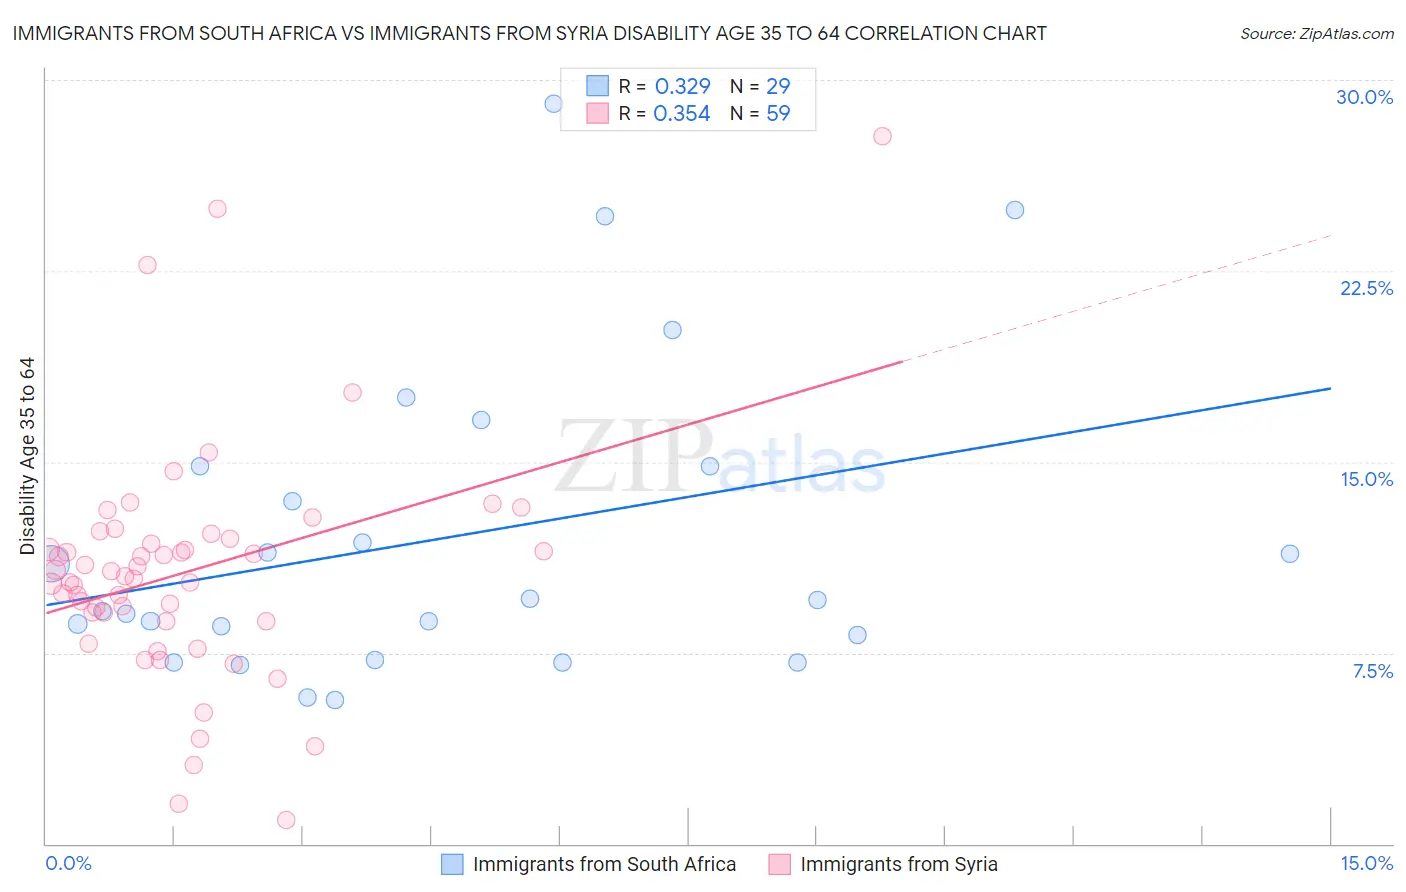
Immigrants from South Africa vs Immigrants from Syria Disability Age 35 to 64 Correlation Chart
The statistical analysis conducted on geographies consisting of 233,242,913 people shows a mild positive correlation between the proportion of Immigrants from South Africa and percentage of population with a disability between the ages 34 and 64 in the United States with a correlation coefficient (R) of 0.329 and weighted average of 10.3%. Similarly, the statistical analysis conducted on geographies consisting of 174,093,313 people shows a mild positive correlation between the proportion of Immigrants from Syria and percentage of population with a disability between the ages 34 and 64 in the United States with a correlation coefficient (R) of 0.354 and weighted average of 10.7%, a difference of 3.5%.
Disability Age 35 to 64 Correlation Summary
| Measurement | Immigrants from South Africa | Immigrants from Syria |
| Minimum | 5.7% | 0.95% |
| Maximum | 29.1% | 27.8% |
| Range | 23.4% | 26.8% |
| Mean | 12.0% | 10.7% |
| Median | 9.6% | 10.5% |
| Interquartile 25% (IQ1) | 7.7% | 8.8% |
| Interquartile 75% (IQ3) | 14.8% | 12.0% |
| Interquartile Range (IQR) | 7.1% | 3.2% |
| Standard Deviation (Sample) | 6.1% | 4.6% |
| Standard Deviation (Population) | 6.0% | 4.6% |
Similar Demographics by Disability Age 35 to 64
Demographics Similar to Immigrants from South Africa by Disability Age 35 to 64
In terms of disability age 35 to 64, the demographic groups most similar to Immigrants from South Africa are Immigrants from Denmark (10.3%, a difference of 0.18%), Immigrants from Italy (10.3%, a difference of 0.24%), Chinese (10.3%, a difference of 0.24%), Immigrants from Uruguay (10.3%, a difference of 0.25%), and Immigrants from North Macedonia (10.3%, a difference of 0.28%).
| Demographics | Rating | Rank | Disability Age 35 to 64 |
| Uruguayans | 99.0 /100 | #89 | Exceptional 10.2% |
| Afghans | 98.9 /100 | #90 | Exceptional 10.3% |
| Immigrants | Lebanon | 98.9 /100 | #91 | Exceptional 10.3% |
| Immigrants | Northern Africa | 98.7 /100 | #92 | Exceptional 10.3% |
| Immigrants | North Macedonia | 98.7 /100 | #93 | Exceptional 10.3% |
| Immigrants | Italy | 98.7 /100 | #94 | Exceptional 10.3% |
| Chinese | 98.7 /100 | #95 | Exceptional 10.3% |
| Immigrants | South Africa | 98.5 /100 | #96 | Exceptional 10.3% |
| Immigrants | Denmark | 98.4 /100 | #97 | Exceptional 10.3% |
| Immigrants | Uruguay | 98.3 /100 | #98 | Exceptional 10.3% |
| Palestinians | 98.2 /100 | #99 | Exceptional 10.4% |
| Immigrants | Jordan | 98.1 /100 | #100 | Exceptional 10.4% |
| Immigrants | Philippines | 98.0 /100 | #101 | Exceptional 10.4% |
| Immigrants | Western Asia | 98.0 /100 | #102 | Exceptional 10.4% |
| Immigrants | Ukraine | 97.9 /100 | #103 | Exceptional 10.4% |
Demographics Similar to Immigrants from Syria by Disability Age 35 to 64
In terms of disability age 35 to 64, the demographic groups most similar to Immigrants from Syria are Ecuadorian (10.7%, a difference of 0.020%), Immigrants from El Salvador (10.7%, a difference of 0.050%), South African (10.7%, a difference of 0.11%), Immigrants from Albania (10.7%, a difference of 0.16%), and Immigrants (10.7%, a difference of 0.16%).
| Demographics | Rating | Rank | Disability Age 35 to 64 |
| Maltese | 94.8 /100 | #123 | Exceptional 10.6% |
| Estonians | 94.5 /100 | #124 | Exceptional 10.6% |
| Albanians | 94.2 /100 | #125 | Exceptional 10.6% |
| Immigrants | Afghanistan | 94.1 /100 | #126 | Exceptional 10.6% |
| Immigrants | Zimbabwe | 94.0 /100 | #127 | Exceptional 10.6% |
| South Africans | 93.3 /100 | #128 | Exceptional 10.7% |
| Ecuadorians | 93.1 /100 | #129 | Exceptional 10.7% |
| Immigrants | Syria | 93.0 /100 | #130 | Exceptional 10.7% |
| Immigrants | El Salvador | 92.8 /100 | #131 | Exceptional 10.7% |
| Immigrants | Albania | 92.5 /100 | #132 | Exceptional 10.7% |
| Immigrants | Immigrants | 92.5 /100 | #133 | Exceptional 10.7% |
| Immigrants | Ecuador | 92.5 /100 | #134 | Exceptional 10.7% |
| Greeks | 92.3 /100 | #135 | Exceptional 10.7% |
| Salvadorans | 91.9 /100 | #136 | Exceptional 10.7% |
| Immigrants | Costa Rica | 91.7 /100 | #137 | Exceptional 10.7% |