Irish vs Bermudan Disability Age 35 to 64
COMPARE
Irish
Bermudan
Disability Age 35 to 64
Disability Age 35 to 64 Comparison
Irish
Bermudans
12.3%
DISABILITY AGE 35 TO 64
1.0/ 100
METRIC RATING
252nd/ 347
METRIC RANK
11.9%
DISABILITY AGE 35 TO 64
5.0/ 100
METRIC RATING
233rd/ 347
METRIC RANK
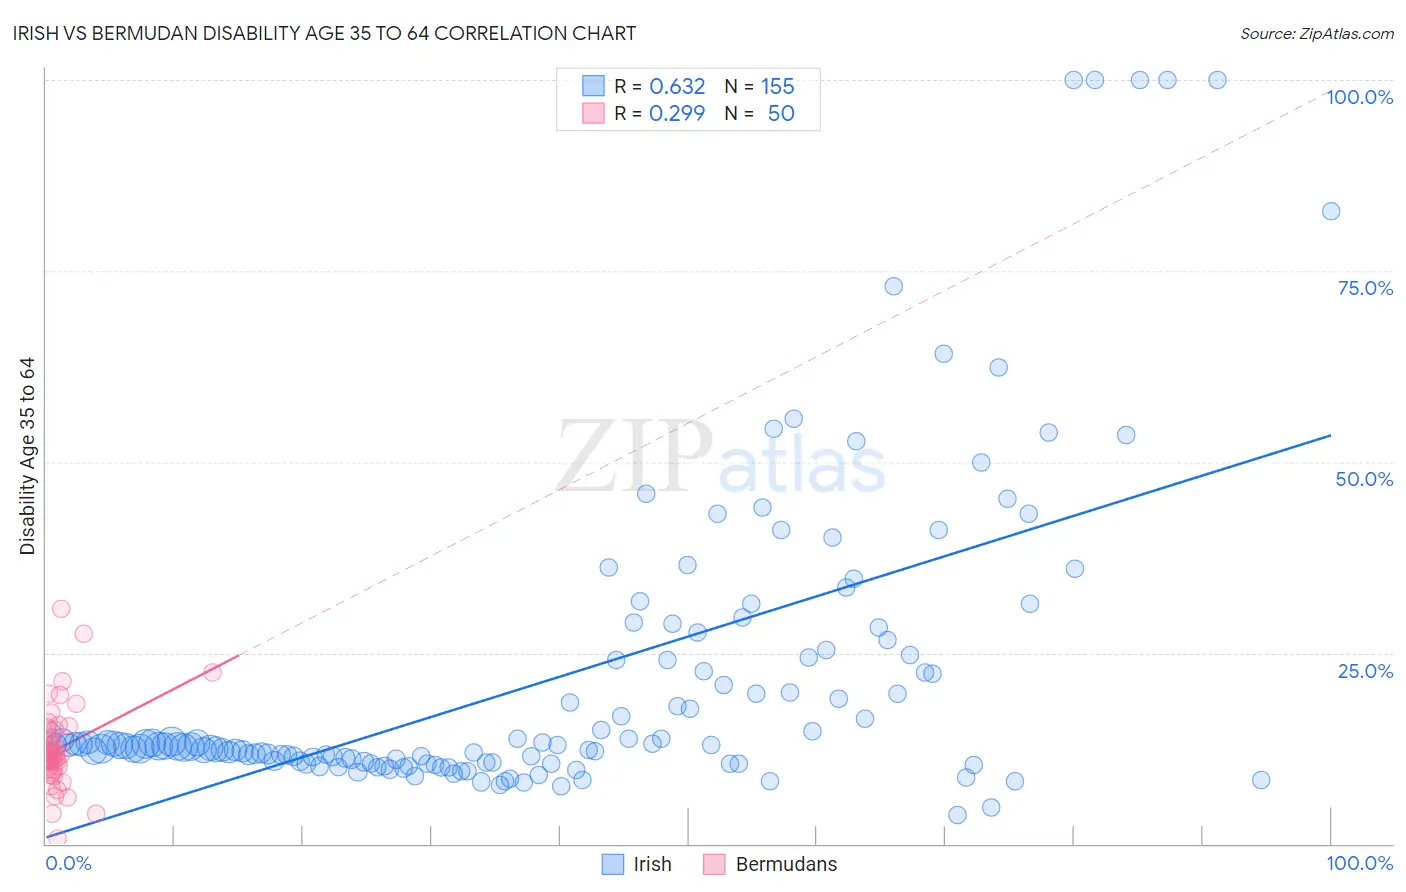
Irish vs Bermudan Disability Age 35 to 64 Correlation Chart
The statistical analysis conducted on geographies consisting of 579,185,352 people shows a significant positive correlation between the proportion of Irish and percentage of population with a disability between the ages 34 and 64 in the United States with a correlation coefficient (R) of 0.632 and weighted average of 12.3%. Similarly, the statistical analysis conducted on geographies consisting of 55,714,337 people shows a weak positive correlation between the proportion of Bermudans and percentage of population with a disability between the ages 34 and 64 in the United States with a correlation coefficient (R) of 0.299 and weighted average of 11.9%, a difference of 3.2%.
Disability Age 35 to 64 Correlation Summary
| Measurement | Irish | Bermudan |
| Minimum | 3.8% | 0.71% |
| Maximum | 100.0% | 30.8% |
| Range | 96.2% | 30.1% |
| Mean | 21.8% | 12.5% |
| Median | 12.9% | 11.6% |
| Interquartile 25% (IQ1) | 10.7% | 9.9% |
| Interquartile 75% (IQ3) | 24.7% | 14.9% |
| Interquartile Range (IQR) | 14.0% | 5.1% |
| Standard Deviation (Sample) | 20.3% | 5.5% |
| Standard Deviation (Population) | 20.2% | 5.4% |
Demographics Similar to Irish and Bermudans by Disability Age 35 to 64
In terms of disability age 35 to 64, the demographic groups most similar to Irish are German (12.3%, a difference of 0.25%), Immigrants from Burma/Myanmar (12.3%, a difference of 0.33%), Hispanic or Latino (12.3%, a difference of 0.47%), Spaniard (12.3%, a difference of 0.49%), and Immigrants from Senegal (12.2%, a difference of 0.59%). Similarly, the demographic groups most similar to Bermudans are Portuguese (11.9%, a difference of 0.070%), Sudanese (11.9%, a difference of 0.11%), Belizean (12.0%, a difference of 0.21%), Immigrants from Middle Africa (12.0%, a difference of 0.23%), and Immigrants from Cambodia (12.0%, a difference of 0.49%).
| Demographics | Rating | Rank | Disability Age 35 to 64 |
| Sudanese | 5.3 /100 | #232 | Tragic 11.9% |
| Bermudans | 5.0 /100 | #233 | Tragic 11.9% |
| Portuguese | 4.9 /100 | #234 | Tragic 11.9% |
| Belizeans | 4.5 /100 | #235 | Tragic 12.0% |
| Immigrants | Middle Africa | 4.5 /100 | #236 | Tragic 12.0% |
| Immigrants | Cambodia | 3.9 /100 | #237 | Tragic 12.0% |
| West Indians | 3.7 /100 | #238 | Tragic 12.0% |
| Immigrants | Western Africa | 3.3 /100 | #239 | Tragic 12.0% |
| Immigrants | Thailand | 3.3 /100 | #240 | Tragic 12.0% |
| Mexican American Indians | 3.2 /100 | #241 | Tragic 12.0% |
| Samoans | 2.8 /100 | #242 | Tragic 12.1% |
| Slovaks | 2.7 /100 | #243 | Tragic 12.1% |
| Finns | 2.3 /100 | #244 | Tragic 12.1% |
| Immigrants | Mexico | 2.2 /100 | #245 | Tragic 12.1% |
| Guamanians/Chamorros | 1.4 /100 | #246 | Tragic 12.2% |
| Immigrants | Senegal | 1.3 /100 | #247 | Tragic 12.2% |
| Spaniards | 1.3 /100 | #248 | Tragic 12.3% |
| Hispanics or Latinos | 1.3 /100 | #249 | Tragic 12.3% |
| Immigrants | Burma/Myanmar | 1.2 /100 | #250 | Tragic 12.3% |
| Germans | 1.1 /100 | #251 | Tragic 12.3% |
| Irish | 1.0 /100 | #252 | Tragic 12.3% |