Immigrants from Vietnam vs Vietnamese Disability Age Over 75
COMPARE
Immigrants from Vietnam
Vietnamese
Disability Age Over 75
Disability Age Over 75 Comparison
Immigrants from Vietnam
Vietnamese
48.7%
DISABILITY AGE OVER 75
0.6/ 100
METRIC RATING
254th/ 347
METRIC RANK
47.9%
DISABILITY AGE OVER 75
11.9/ 100
METRIC RATING
210th/ 347
METRIC RANK
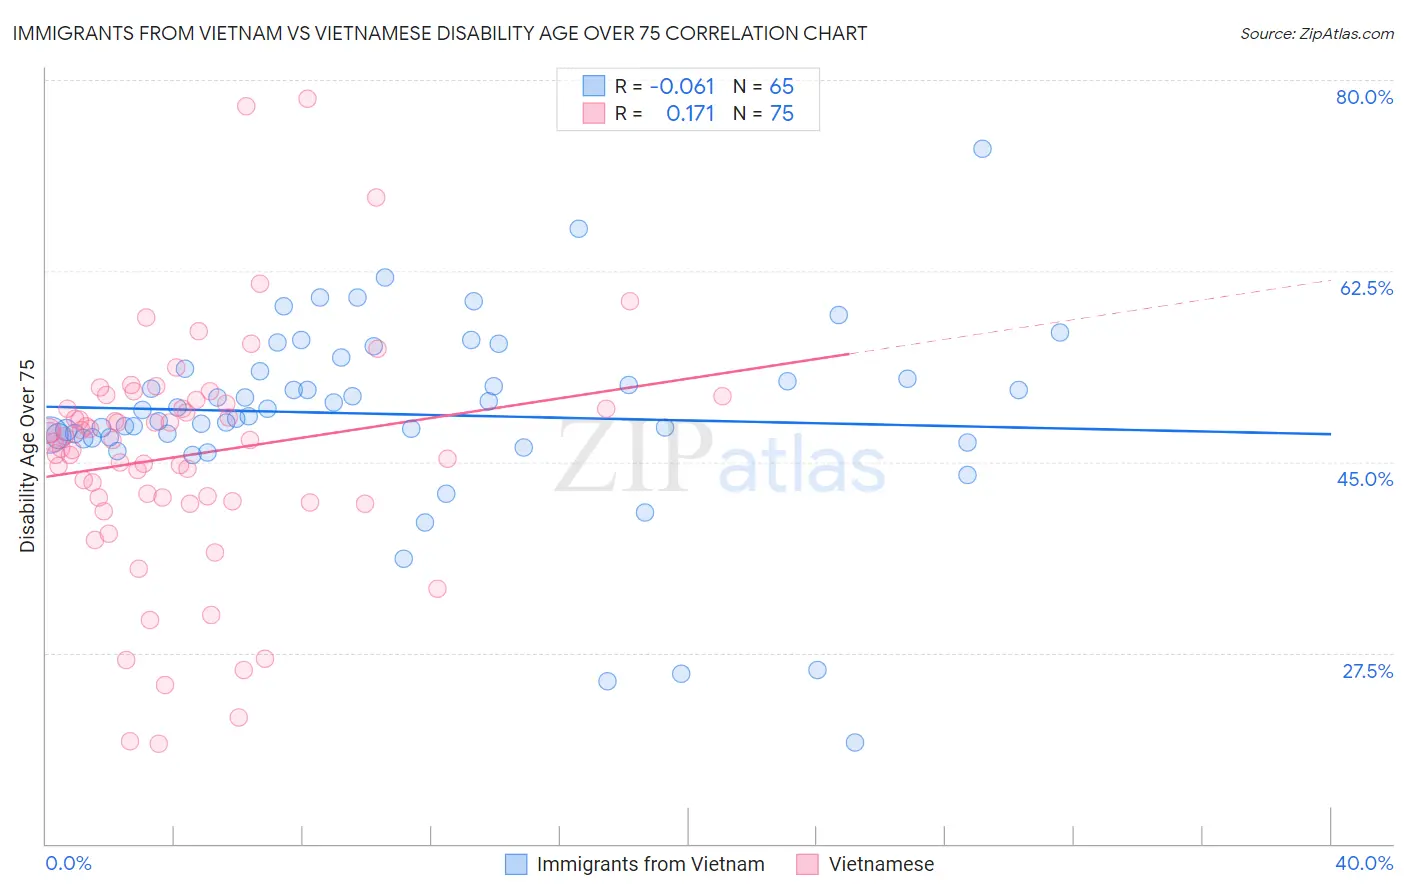
Immigrants from Vietnam vs Vietnamese Disability Age Over 75 Correlation Chart
The statistical analysis conducted on geographies consisting of 404,227,472 people shows a slight negative correlation between the proportion of Immigrants from Vietnam and percentage of population with a disability over the age of 75 in the United States with a correlation coefficient (R) of -0.061 and weighted average of 48.7%. Similarly, the statistical analysis conducted on geographies consisting of 170,542,891 people shows a poor positive correlation between the proportion of Vietnamese and percentage of population with a disability over the age of 75 in the United States with a correlation coefficient (R) of 0.171 and weighted average of 47.9%, a difference of 1.8%.
Disability Age Over 75 Correlation Summary
| Measurement | Immigrants from Vietnam | Vietnamese |
| Minimum | 19.3% | 19.1% |
| Maximum | 73.7% | 78.3% |
| Range | 54.4% | 59.2% |
| Mean | 49.4% | 45.6% |
| Median | 49.7% | 47.0% |
| Interquartile 25% (IQ1) | 47.3% | 41.4% |
| Interquartile 75% (IQ3) | 53.4% | 50.3% |
| Interquartile Range (IQR) | 6.2% | 8.9% |
| Standard Deviation (Sample) | 8.9% | 10.8% |
| Standard Deviation (Population) | 8.9% | 10.8% |
Similar Demographics by Disability Age Over 75
Demographics Similar to Immigrants from Vietnam by Disability Age Over 75
In terms of disability age over 75, the demographic groups most similar to Immigrants from Vietnam are British West Indian (48.7%, a difference of 0.030%), Chinese (48.7%, a difference of 0.040%), Immigrants from Congo (48.7%, a difference of 0.050%), Immigrants from South Eastern Asia (48.7%, a difference of 0.080%), and Blackfeet (48.8%, a difference of 0.10%).
| Demographics | Rating | Rank | Disability Age Over 75 |
| Iroquois | 1.6 /100 | #247 | Tragic 48.4% |
| Sri Lankans | 1.4 /100 | #248 | Tragic 48.5% |
| Iraqis | 1.0 /100 | #249 | Tragic 48.6% |
| West Indians | 0.8 /100 | #250 | Tragic 48.6% |
| Koreans | 0.8 /100 | #251 | Tragic 48.6% |
| Immigrants | South Eastern Asia | 0.7 /100 | #252 | Tragic 48.7% |
| British West Indians | 0.6 /100 | #253 | Tragic 48.7% |
| Immigrants | Vietnam | 0.6 /100 | #254 | Tragic 48.7% |
| Chinese | 0.5 /100 | #255 | Tragic 48.7% |
| Immigrants | Congo | 0.5 /100 | #256 | Tragic 48.7% |
| Blackfeet | 0.5 /100 | #257 | Tragic 48.8% |
| Immigrants | Philippines | 0.4 /100 | #258 | Tragic 48.8% |
| Central Americans | 0.4 /100 | #259 | Tragic 48.8% |
| Immigrants | Afghanistan | 0.4 /100 | #260 | Tragic 48.8% |
| Africans | 0.3 /100 | #261 | Tragic 48.9% |
Demographics Similar to Vietnamese by Disability Age Over 75
In terms of disability age over 75, the demographic groups most similar to Vietnamese are Panamanian (47.9%, a difference of 0.010%), Immigrants from Burma/Myanmar (47.9%, a difference of 0.010%), Laotian (47.9%, a difference of 0.020%), Immigrants from Barbados (47.9%, a difference of 0.070%), and Senegalese (47.9%, a difference of 0.070%).
| Demographics | Rating | Rank | Disability Age Over 75 |
| Trinidadians and Tobagonians | 20.0 /100 | #203 | Fair 47.7% |
| Nigerians | 19.2 /100 | #204 | Poor 47.7% |
| Immigrants | Ghana | 19.1 /100 | #205 | Poor 47.7% |
| Jamaicans | 19.0 /100 | #206 | Poor 47.7% |
| Immigrants | Syria | 17.4 /100 | #207 | Poor 47.8% |
| Immigrants | Senegal | 16.9 /100 | #208 | Poor 47.8% |
| Immigrants | Indonesia | 14.2 /100 | #209 | Poor 47.8% |
| Vietnamese | 11.9 /100 | #210 | Poor 47.9% |
| Panamanians | 11.8 /100 | #211 | Poor 47.9% |
| Immigrants | Burma/Myanmar | 11.7 /100 | #212 | Poor 47.9% |
| Laotians | 11.5 /100 | #213 | Poor 47.9% |
| Immigrants | Barbados | 10.7 /100 | #214 | Poor 47.9% |
| Senegalese | 10.7 /100 | #215 | Poor 47.9% |
| Immigrants | Panama | 10.2 /100 | #216 | Poor 47.9% |
| Immigrants | Grenada | 9.4 /100 | #217 | Tragic 47.9% |