Immigrants from Honduras vs Cambodian Hearing Disability
COMPARE
Immigrants from Honduras
Cambodian
Hearing Disability
Hearing Disability Comparison
Immigrants from Honduras
Cambodians
2.8%
HEARING DISABILITY
95.1/ 100
METRIC RATING
98th/ 347
METRIC RANK
2.8%
HEARING DISABILITY
91.1/ 100
METRIC RATING
114th/ 347
METRIC RANK
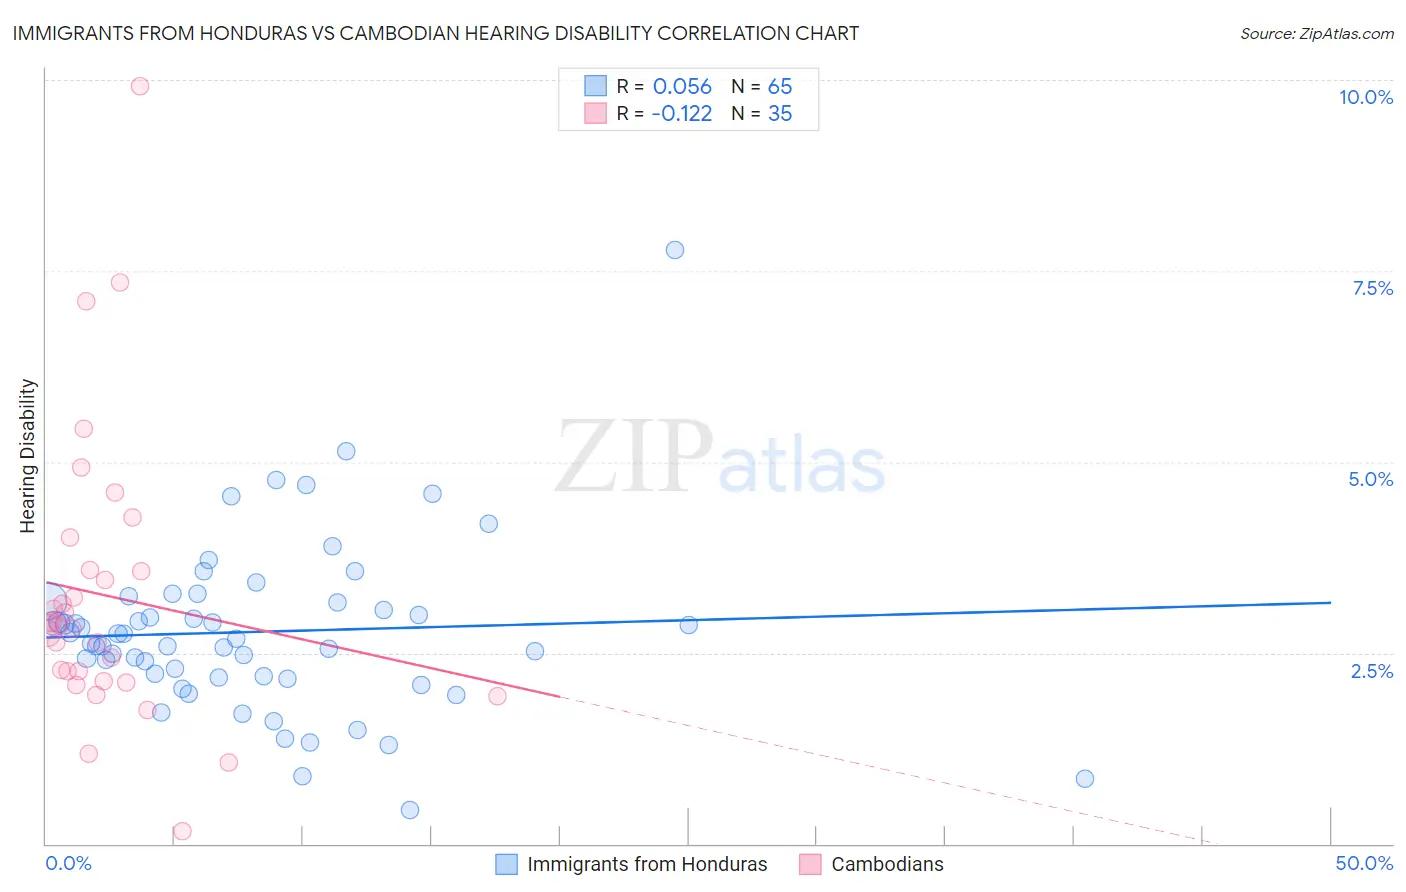
Immigrants from Honduras vs Cambodian Hearing Disability Correlation Chart
The statistical analysis conducted on geographies consisting of 322,511,420 people shows a slight positive correlation between the proportion of Immigrants from Honduras and percentage of population with hearing disability in the United States with a correlation coefficient (R) of 0.056 and weighted average of 2.8%. Similarly, the statistical analysis conducted on geographies consisting of 102,495,279 people shows a poor negative correlation between the proportion of Cambodians and percentage of population with hearing disability in the United States with a correlation coefficient (R) of -0.122 and weighted average of 2.8%, a difference of 1.6%.
Hearing Disability Correlation Summary
| Measurement | Immigrants from Honduras | Cambodian |
| Minimum | 0.44% | 0.17% |
| Maximum | 7.8% | 9.9% |
| Range | 7.3% | 9.7% |
| Mean | 2.8% | 3.3% |
| Median | 2.7% | 2.9% |
| Interquartile 25% (IQ1) | 2.2% | 2.1% |
| Interquartile 75% (IQ3) | 3.2% | 3.6% |
| Interquartile Range (IQR) | 0.98% | 1.4% |
| Standard Deviation (Sample) | 1.1% | 1.9% |
| Standard Deviation (Population) | 1.1% | 1.9% |
Demographics Similar to Immigrants from Honduras and Cambodians by Hearing Disability
In terms of hearing disability, the demographic groups most similar to Immigrants from Honduras are Immigrants from Guatemala (2.8%, a difference of 0.040%), Immigrants from Afghanistan (2.8%, a difference of 0.060%), Immigrants from Eastern Africa (2.8%, a difference of 0.090%), Immigrants from Spain (2.8%, a difference of 0.15%), and Taiwanese (2.8%, a difference of 0.16%). Similarly, the demographic groups most similar to Cambodians are Immigrants from Belarus (2.8%, a difference of 0.17%), Immigrants from Latin America (2.8%, a difference of 0.17%), Immigrants (2.8%, a difference of 0.24%), U.S. Virgin Islander (2.8%, a difference of 0.48%), and Immigrants from Yemen (2.8%, a difference of 0.56%).
| Demographics | Rating | Rank | Hearing Disability |
| Immigrants | Somalia | 95.5 /100 | #96 | Exceptional 2.8% |
| Immigrants | Afghanistan | 95.3 /100 | #97 | Exceptional 2.8% |
| Immigrants | Honduras | 95.1 /100 | #98 | Exceptional 2.8% |
| Immigrants | Guatemala | 95.1 /100 | #99 | Exceptional 2.8% |
| Immigrants | Eastern Africa | 95.0 /100 | #100 | Exceptional 2.8% |
| Immigrants | Spain | 94.9 /100 | #101 | Exceptional 2.8% |
| Taiwanese | 94.8 /100 | #102 | Exceptional 2.8% |
| Immigrants | Indonesia | 94.7 /100 | #103 | Exceptional 2.8% |
| Burmese | 94.2 /100 | #104 | Exceptional 2.8% |
| Moroccans | 93.9 /100 | #105 | Exceptional 2.8% |
| Hondurans | 93.4 /100 | #106 | Exceptional 2.8% |
| Immigrants | Chile | 93.4 /100 | #107 | Exceptional 2.8% |
| Guatemalans | 93.2 /100 | #108 | Exceptional 2.8% |
| Turks | 93.0 /100 | #109 | Exceptional 2.8% |
| Cypriots | 92.9 /100 | #110 | Exceptional 2.8% |
| Immigrants | Yemen | 92.7 /100 | #111 | Exceptional 2.8% |
| U.S. Virgin Islanders | 92.5 /100 | #112 | Exceptional 2.8% |
| Immigrants | Belarus | 91.6 /100 | #113 | Exceptional 2.8% |
| Cambodians | 91.1 /100 | #114 | Exceptional 2.8% |
| Immigrants | Latin America | 90.5 /100 | #115 | Exceptional 2.8% |
| Immigrants | Immigrants | 90.3 /100 | #116 | Exceptional 2.8% |