U.S. Virgin Islander vs Korean Vision Disability
COMPARE
U.S. Virgin Islander
Korean
Vision Disability
Vision Disability Comparison
U.S. Virgin Islanders
Koreans
2.5%
VISION DISABILITY
0.0/ 100
METRIC RATING
281st/ 347
METRIC RANK
2.1%
VISION DISABILITY
94.1/ 100
METRIC RATING
108th/ 347
METRIC RANK
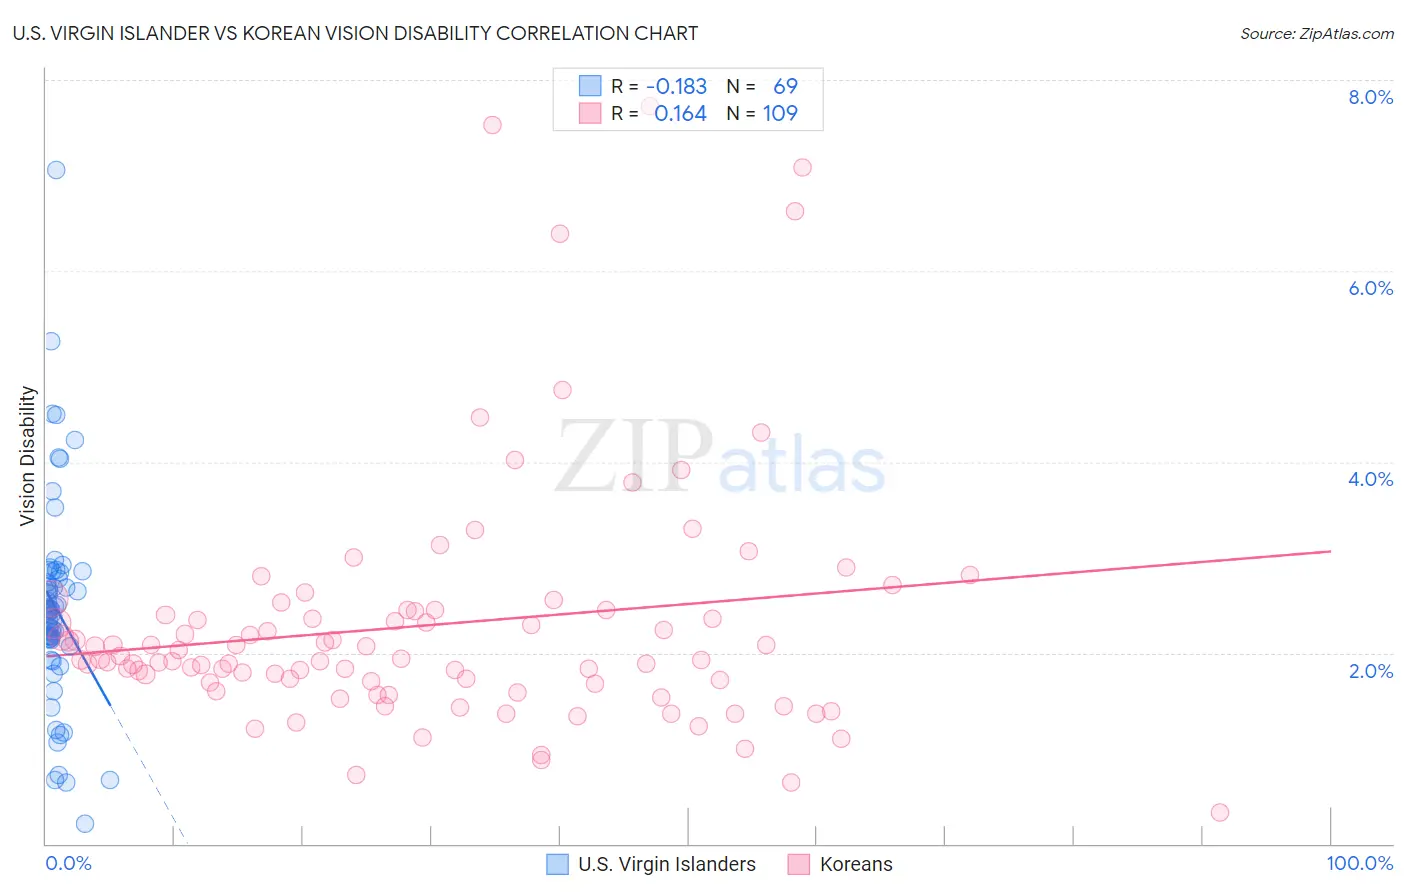
U.S. Virgin Islander vs Korean Vision Disability Correlation Chart
The statistical analysis conducted on geographies consisting of 87,464,178 people shows a poor negative correlation between the proportion of U.S. Virgin Islanders and percentage of population with vision disability in the United States with a correlation coefficient (R) of -0.183 and weighted average of 2.5%. Similarly, the statistical analysis conducted on geographies consisting of 510,182,066 people shows a poor positive correlation between the proportion of Koreans and percentage of population with vision disability in the United States with a correlation coefficient (R) of 0.164 and weighted average of 2.1%, a difference of 18.3%.
Vision Disability Correlation Summary
| Measurement | U.S. Virgin Islander | Korean |
| Minimum | 0.21% | 0.33% |
| Maximum | 7.1% | 7.7% |
| Range | 6.8% | 7.4% |
| Mean | 2.5% | 2.3% |
| Median | 2.4% | 1.9% |
| Interquartile 25% (IQ1) | 2.1% | 1.7% |
| Interquartile 75% (IQ3) | 2.8% | 2.4% |
| Interquartile Range (IQR) | 0.67% | 0.76% |
| Standard Deviation (Sample) | 1.1% | 1.3% |
| Standard Deviation (Population) | 1.1% | 1.3% |
Similar Demographics by Vision Disability
Demographics Similar to U.S. Virgin Islanders by Vision Disability
In terms of vision disability, the demographic groups most similar to U.S. Virgin Islanders are Immigrants from Caribbean (2.5%, a difference of 0.12%), Cape Verdean (2.4%, a difference of 0.23%), Puget Sound Salish (2.5%, a difference of 0.25%), Nepalese (2.4%, a difference of 0.27%), and Spanish (2.4%, a difference of 0.28%).
| Demographics | Rating | Rank | Vision Disability |
| Immigrants | Latin America | 0.0 /100 | #274 | Tragic 2.4% |
| Chippewa | 0.0 /100 | #275 | Tragic 2.4% |
| Scotch-Irish | 0.0 /100 | #276 | Tragic 2.4% |
| Bahamians | 0.0 /100 | #277 | Tragic 2.4% |
| Spanish | 0.0 /100 | #278 | Tragic 2.4% |
| Nepalese | 0.0 /100 | #279 | Tragic 2.4% |
| Cape Verdeans | 0.0 /100 | #280 | Tragic 2.4% |
| U.S. Virgin Islanders | 0.0 /100 | #281 | Tragic 2.5% |
| Immigrants | Caribbean | 0.0 /100 | #282 | Tragic 2.5% |
| Puget Sound Salish | 0.0 /100 | #283 | Tragic 2.5% |
| Yakama | 0.0 /100 | #284 | Tragic 2.5% |
| Immigrants | Central America | 0.0 /100 | #285 | Tragic 2.5% |
| Sioux | 0.0 /100 | #286 | Tragic 2.5% |
| Hondurans | 0.0 /100 | #287 | Tragic 2.5% |
| French American Indians | 0.0 /100 | #288 | Tragic 2.5% |
Demographics Similar to Koreans by Vision Disability
In terms of vision disability, the demographic groups most similar to Koreans are Chilean (2.1%, a difference of 0.020%), Swedish (2.1%, a difference of 0.030%), Danish (2.1%, a difference of 0.030%), Carpatho Rusyn (2.1%, a difference of 0.080%), and Immigrants from Italy (2.1%, a difference of 0.090%).
| Demographics | Rating | Rank | Vision Disability |
| Albanians | 94.9 /100 | #101 | Exceptional 2.1% |
| Sri Lankans | 94.8 /100 | #102 | Exceptional 2.1% |
| Immigrants | Austria | 94.4 /100 | #103 | Exceptional 2.1% |
| Immigrants | Italy | 94.4 /100 | #104 | Exceptional 2.1% |
| Carpatho Rusyns | 94.3 /100 | #105 | Exceptional 2.1% |
| Swedes | 94.2 /100 | #106 | Exceptional 2.1% |
| Danes | 94.2 /100 | #107 | Exceptional 2.1% |
| Koreans | 94.1 /100 | #108 | Exceptional 2.1% |
| Chileans | 94.0 /100 | #109 | Exceptional 2.1% |
| Immigrants | Armenia | 93.8 /100 | #110 | Exceptional 2.1% |
| Peruvians | 93.5 /100 | #111 | Exceptional 2.1% |
| Immigrants | Denmark | 92.9 /100 | #112 | Exceptional 2.1% |
| Kenyans | 92.5 /100 | #113 | Exceptional 2.1% |
| Croatians | 92.3 /100 | #114 | Exceptional 2.1% |
| Immigrants | Vietnam | 92.2 /100 | #115 | Exceptional 2.1% |