Cuban vs Mexican American Indian Cognitive Disability
COMPARE
Cuban
Mexican American Indian
Cognitive Disability
Cognitive Disability Comparison
Cubans
Mexican American Indians
16.5%
COGNITIVE DISABILITY
99.9/ 100
METRIC RATING
41st/ 347
METRIC RANK
17.9%
COGNITIVE DISABILITY
0.6/ 100
METRIC RATING
257th/ 347
METRIC RANK
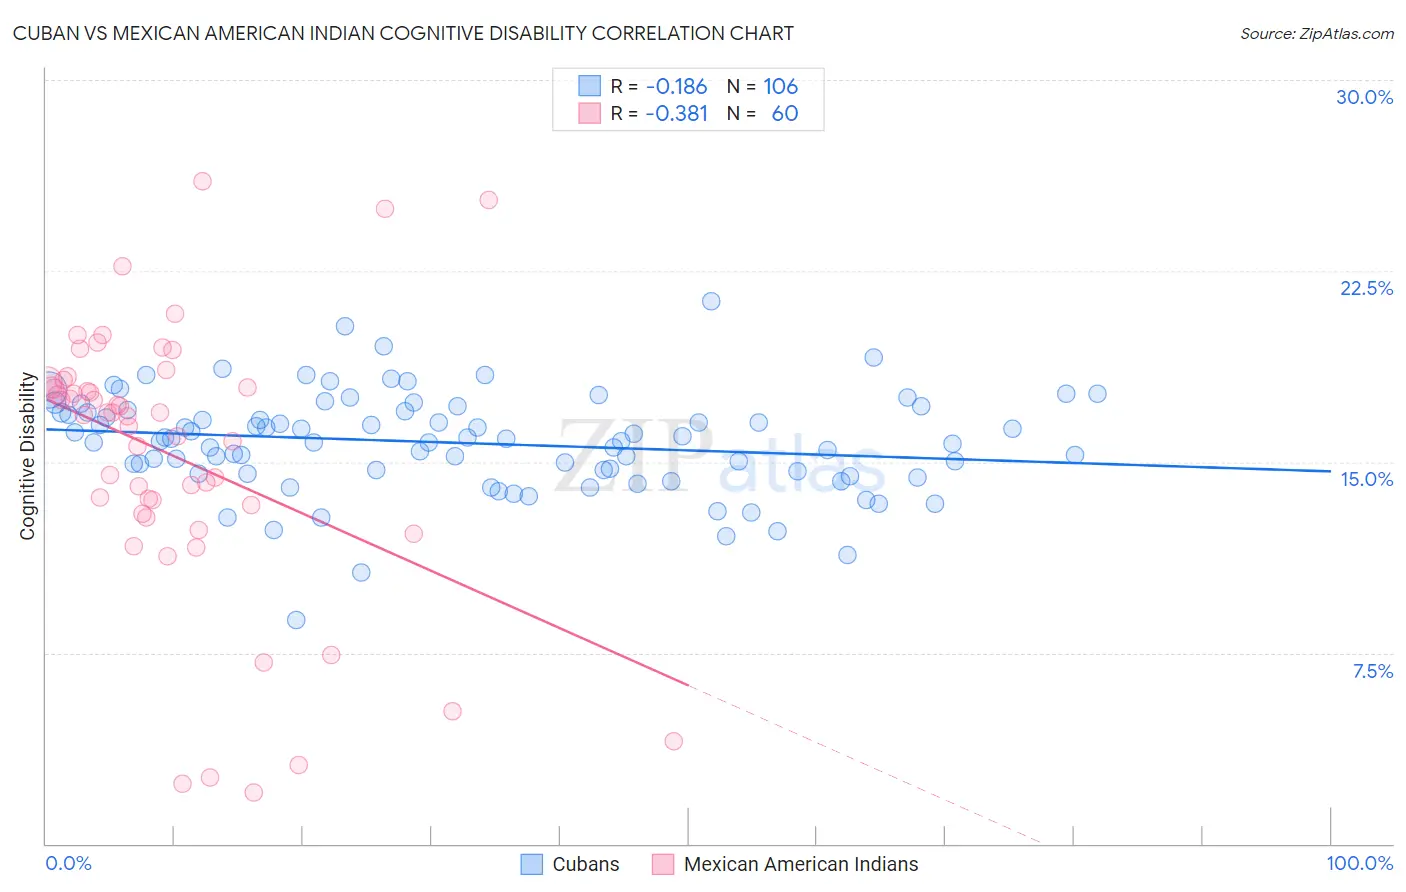
Cuban vs Mexican American Indian Cognitive Disability Correlation Chart
The statistical analysis conducted on geographies consisting of 449,269,783 people shows a poor negative correlation between the proportion of Cubans and percentage of population with cognitive disability in the United States with a correlation coefficient (R) of -0.186 and weighted average of 16.5%. Similarly, the statistical analysis conducted on geographies consisting of 317,571,331 people shows a mild negative correlation between the proportion of Mexican American Indians and percentage of population with cognitive disability in the United States with a correlation coefficient (R) of -0.381 and weighted average of 17.9%, a difference of 8.7%.
Cognitive Disability Correlation Summary
| Measurement | Cuban | Mexican American Indian |
| Minimum | 8.8% | 2.0% |
| Maximum | 21.3% | 26.0% |
| Range | 12.5% | 24.0% |
| Mean | 15.7% | 15.2% |
| Median | 15.9% | 16.9% |
| Interquartile 25% (IQ1) | 14.7% | 13.1% |
| Interquartile 75% (IQ3) | 17.0% | 18.0% |
| Interquartile Range (IQR) | 2.3% | 4.9% |
| Standard Deviation (Sample) | 2.0% | 5.4% |
| Standard Deviation (Population) | 2.0% | 5.4% |
Similar Demographics by Cognitive Disability
Demographics Similar to Cubans by Cognitive Disability
In terms of cognitive disability, the demographic groups most similar to Cubans are Immigrants from Belarus (16.5%, a difference of 0.0%), Hungarian (16.5%, a difference of 0.010%), Bolivian (16.5%, a difference of 0.020%), Immigrants from Canada (16.5%, a difference of 0.080%), and Immigrants from Eastern Europe (16.5%, a difference of 0.090%).
| Demographics | Rating | Rank | Cognitive Disability |
| Russians | 99.9 /100 | #34 | Exceptional 16.4% |
| Slovaks | 99.9 /100 | #35 | Exceptional 16.4% |
| Greeks | 99.9 /100 | #36 | Exceptional 16.4% |
| Slovenes | 99.9 /100 | #37 | Exceptional 16.5% |
| Immigrants | Eastern Europe | 99.9 /100 | #38 | Exceptional 16.5% |
| Bolivians | 99.9 /100 | #39 | Exceptional 16.5% |
| Immigrants | Belarus | 99.9 /100 | #40 | Exceptional 16.5% |
| Cubans | 99.9 /100 | #41 | Exceptional 16.5% |
| Hungarians | 99.9 /100 | #42 | Exceptional 16.5% |
| Immigrants | Canada | 99.8 /100 | #43 | Exceptional 16.5% |
| Macedonians | 99.8 /100 | #44 | Exceptional 16.5% |
| Immigrants | Europe | 99.8 /100 | #45 | Exceptional 16.5% |
| Immigrants | Colombia | 99.8 /100 | #46 | Exceptional 16.5% |
| Immigrants | Italy | 99.8 /100 | #47 | Exceptional 16.5% |
| Immigrants | North America | 99.8 /100 | #48 | Exceptional 16.5% |
Demographics Similar to Mexican American Indians by Cognitive Disability
In terms of cognitive disability, the demographic groups most similar to Mexican American Indians are Immigrants from Armenia (17.9%, a difference of 0.010%), Bahamian (17.9%, a difference of 0.040%), Hopi (17.9%, a difference of 0.050%), Hispanic or Latino (17.9%, a difference of 0.050%), and Immigrants from the Azores (17.9%, a difference of 0.050%).
| Demographics | Rating | Rank | Cognitive Disability |
| Immigrants | Ethiopia | 0.7 /100 | #250 | Tragic 17.9% |
| Malaysians | 0.6 /100 | #251 | Tragic 17.9% |
| Immigrants | Grenada | 0.6 /100 | #252 | Tragic 17.9% |
| Hopi | 0.6 /100 | #253 | Tragic 17.9% |
| Hispanics or Latinos | 0.6 /100 | #254 | Tragic 17.9% |
| Immigrants | Azores | 0.6 /100 | #255 | Tragic 17.9% |
| Bahamians | 0.6 /100 | #256 | Tragic 17.9% |
| Mexican American Indians | 0.6 /100 | #257 | Tragic 17.9% |
| Immigrants | Armenia | 0.6 /100 | #258 | Tragic 17.9% |
| Ethiopians | 0.5 /100 | #259 | Tragic 17.9% |
| Immigrants | Belize | 0.5 /100 | #260 | Tragic 17.9% |
| Guamanians/Chamorros | 0.5 /100 | #261 | Tragic 17.9% |
| Sierra Leoneans | 0.4 /100 | #262 | Tragic 17.9% |
| Immigrants | Barbados | 0.4 /100 | #263 | Tragic 17.9% |
| Menominee | 0.4 /100 | #264 | Tragic 18.0% |