Immigrants from Oceania vs Immigrants from Scotland Disability Age 65 to 74
COMPARE
Immigrants from Oceania
Immigrants from Scotland
Disability Age 65 to 74
Disability Age 65 to 74 Comparison
Immigrants from Oceania
Immigrants from Scotland
24.0%
DISABILITY AGE 65 TO 74
13.6/ 100
METRIC RATING
214th/ 347
METRIC RANK
21.7%
DISABILITY AGE 65 TO 74
99.3/ 100
METRIC RATING
68th/ 347
METRIC RANK
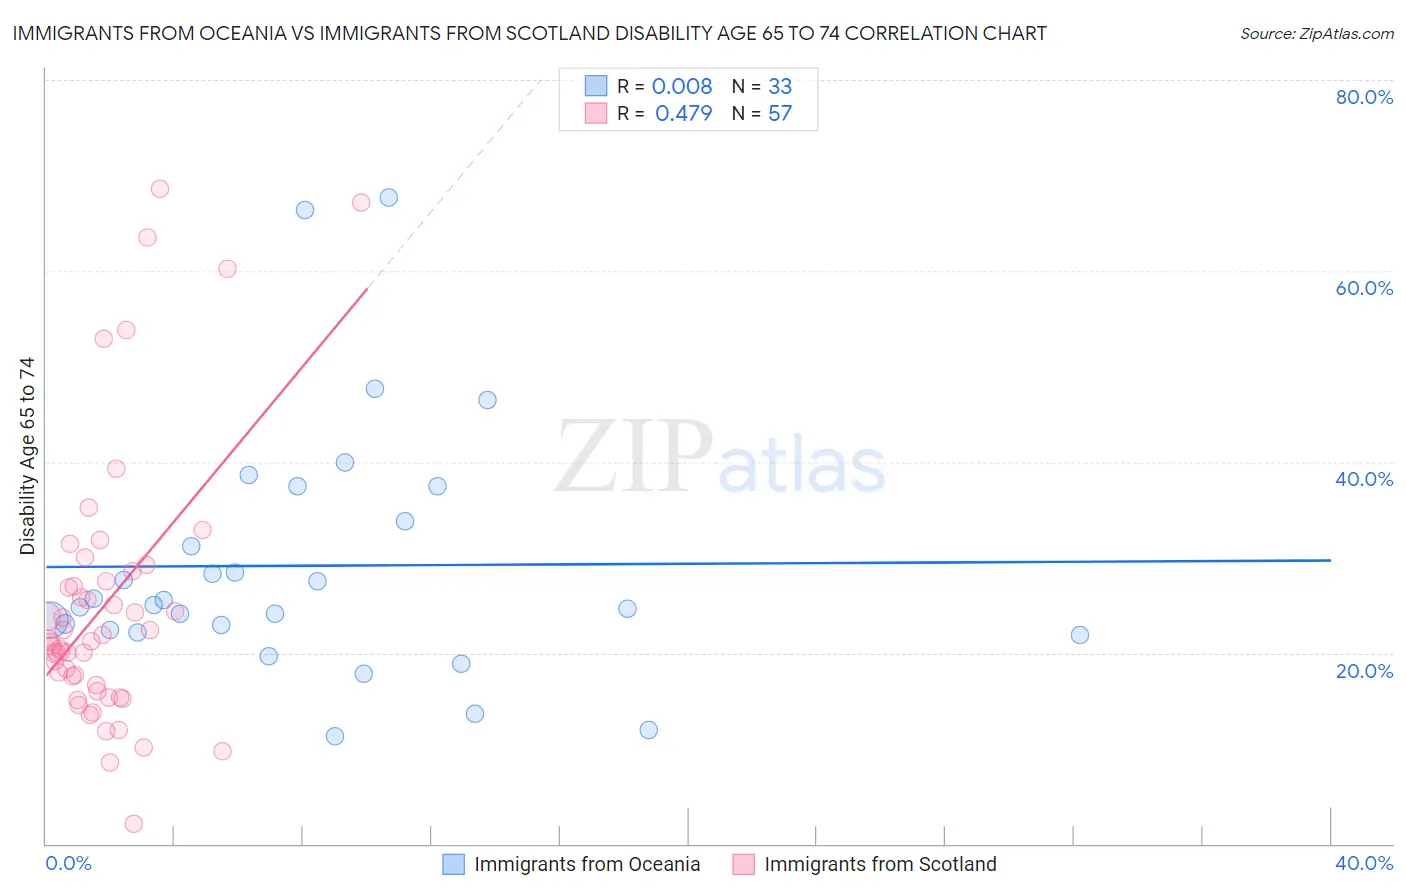
Immigrants from Oceania vs Immigrants from Scotland Disability Age 65 to 74 Correlation Chart
The statistical analysis conducted on geographies consisting of 304,918,832 people shows no correlation between the proportion of Immigrants from Oceania and percentage of population with a disability between the ages 65 and 75 in the United States with a correlation coefficient (R) of 0.008 and weighted average of 24.0%. Similarly, the statistical analysis conducted on geographies consisting of 196,345,839 people shows a moderate positive correlation between the proportion of Immigrants from Scotland and percentage of population with a disability between the ages 65 and 75 in the United States with a correlation coefficient (R) of 0.479 and weighted average of 21.7%, a difference of 10.6%.
Disability Age 65 to 74 Correlation Summary
| Measurement | Immigrants from Oceania | Immigrants from Scotland |
| Minimum | 11.3% | 2.1% |
| Maximum | 67.7% | 68.7% |
| Range | 56.4% | 66.6% |
| Mean | 29.1% | 25.1% |
| Median | 25.1% | 21.2% |
| Interquartile 25% (IQ1) | 22.2% | 16.3% |
| Interquartile 75% (IQ3) | 35.6% | 28.0% |
| Interquartile Range (IQR) | 13.3% | 11.7% |
| Standard Deviation (Sample) | 13.1% | 14.3% |
| Standard Deviation (Population) | 12.9% | 14.2% |
Similar Demographics by Disability Age 65 to 74
Demographics Similar to Immigrants from Oceania by Disability Age 65 to 74
In terms of disability age 65 to 74, the demographic groups most similar to Immigrants from Oceania are Pennsylvania German (24.0%, a difference of 0.040%), Nicaraguan (23.9%, a difference of 0.080%), Jamaican (24.0%, a difference of 0.18%), French (23.9%, a difference of 0.24%), and Immigrants from Portugal (24.0%, a difference of 0.24%).
| Demographics | Rating | Rank | Disability Age 65 to 74 |
| Immigrants | Sudan | 20.1 /100 | #207 | Fair 23.8% |
| Immigrants | Barbados | 19.6 /100 | #208 | Poor 23.8% |
| Immigrants | Kenya | 19.6 /100 | #209 | Poor 23.8% |
| Trinidadians and Tobagonians | 16.4 /100 | #210 | Poor 23.9% |
| Immigrants | West Indies | 15.9 /100 | #211 | Poor 23.9% |
| French | 15.7 /100 | #212 | Poor 23.9% |
| Nicaraguans | 14.3 /100 | #213 | Poor 23.9% |
| Immigrants | Oceania | 13.6 /100 | #214 | Poor 24.0% |
| Pennsylvania Germans | 13.3 /100 | #215 | Poor 24.0% |
| Jamaicans | 12.2 /100 | #216 | Poor 24.0% |
| Immigrants | Portugal | 11.7 /100 | #217 | Poor 24.0% |
| Immigrants | Nigeria | 11.7 /100 | #218 | Poor 24.0% |
| Immigrants | Burma/Myanmar | 11.6 /100 | #219 | Poor 24.0% |
| Ghanaians | 10.4 /100 | #220 | Poor 24.1% |
| Immigrants | Nicaragua | 9.8 /100 | #221 | Tragic 24.1% |
Demographics Similar to Immigrants from Scotland by Disability Age 65 to 74
In terms of disability age 65 to 74, the demographic groups most similar to Immigrants from Scotland are Immigrants from South Africa (21.7%, a difference of 0.090%), Immigrants from Egypt (21.7%, a difference of 0.13%), Chinese (21.7%, a difference of 0.13%), Immigrants from Belarus (21.7%, a difference of 0.19%), and Immigrants from Hungary (21.7%, a difference of 0.20%).
| Demographics | Rating | Rank | Disability Age 65 to 74 |
| Egyptians | 99.5 /100 | #61 | Exceptional 21.6% |
| Carpatho Rusyns | 99.5 /100 | #62 | Exceptional 21.6% |
| Immigrants | Europe | 99.4 /100 | #63 | Exceptional 21.6% |
| Immigrants | Latvia | 99.4 /100 | #64 | Exceptional 21.6% |
| Immigrants | Russia | 99.4 /100 | #65 | Exceptional 21.6% |
| Maltese | 99.4 /100 | #66 | Exceptional 21.6% |
| Immigrants | South Africa | 99.3 /100 | #67 | Exceptional 21.7% |
| Immigrants | Scotland | 99.3 /100 | #68 | Exceptional 21.7% |
| Immigrants | Egypt | 99.2 /100 | #69 | Exceptional 21.7% |
| Chinese | 99.2 /100 | #70 | Exceptional 21.7% |
| Immigrants | Belarus | 99.2 /100 | #71 | Exceptional 21.7% |
| Immigrants | Hungary | 99.2 /100 | #72 | Exceptional 21.7% |
| Immigrants | Venezuela | 99.0 /100 | #73 | Exceptional 21.8% |
| Cambodians | 99.0 /100 | #74 | Exceptional 21.8% |
| Mongolians | 99.0 /100 | #75 | Exceptional 21.8% |