Immigrants from Morocco vs Immigrants from Dominica Ambulatory Disability
COMPARE
Immigrants from Morocco
Immigrants from Dominica
Ambulatory Disability
Ambulatory Disability Comparison
Immigrants from Morocco
Immigrants from Dominica
5.8%
AMBULATORY DISABILITY
97.3/ 100
METRIC RATING
106th/ 347
METRIC RANK
6.9%
AMBULATORY DISABILITY
0.0/ 100
METRIC RATING
289th/ 347
METRIC RANK
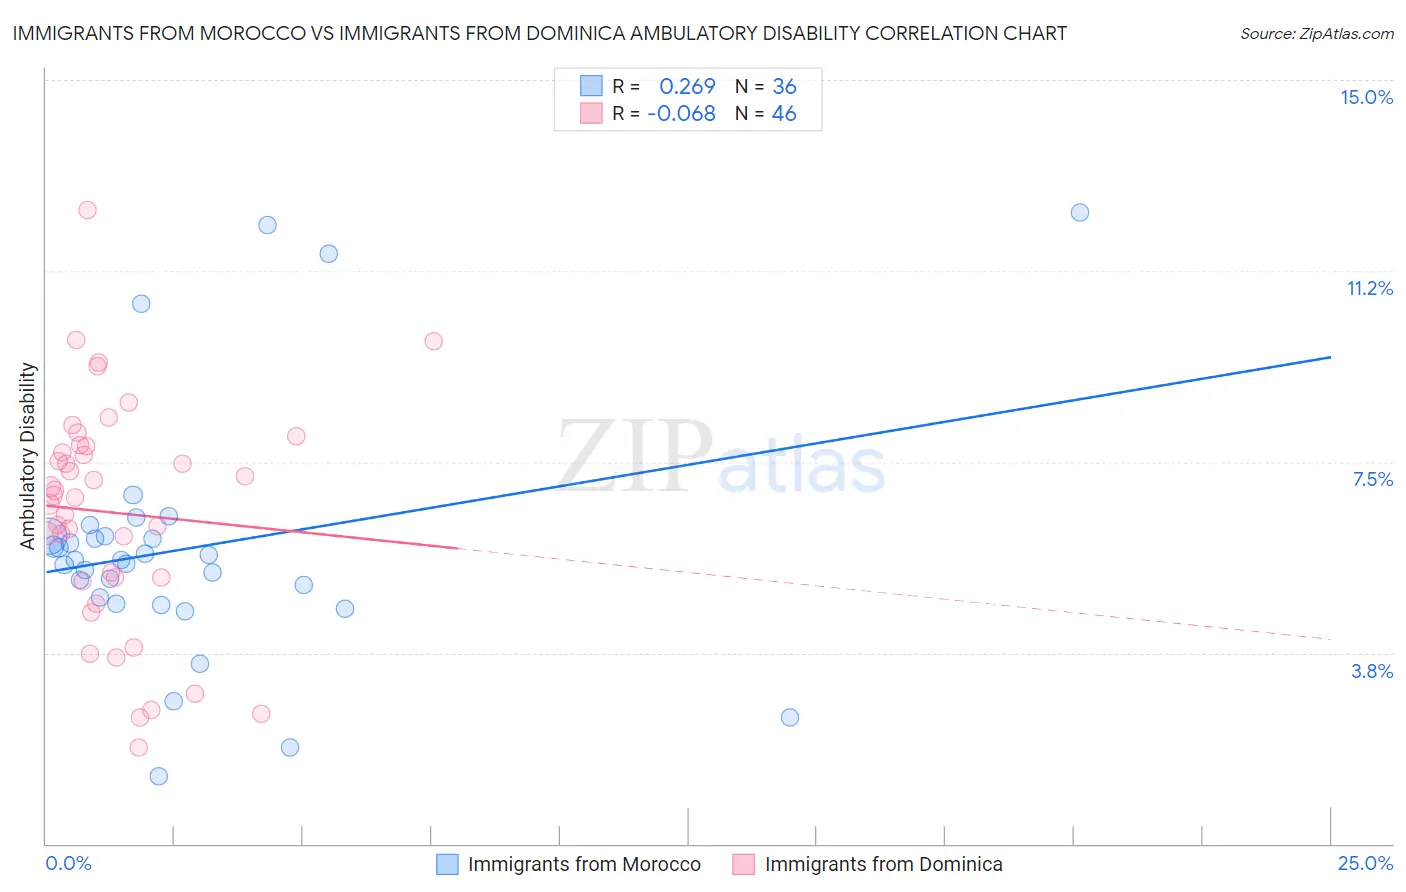
Immigrants from Morocco vs Immigrants from Dominica Ambulatory Disability Correlation Chart
The statistical analysis conducted on geographies consisting of 178,910,370 people shows a weak positive correlation between the proportion of Immigrants from Morocco and percentage of population with ambulatory disability in the United States with a correlation coefficient (R) of 0.269 and weighted average of 5.8%. Similarly, the statistical analysis conducted on geographies consisting of 83,791,064 people shows a slight negative correlation between the proportion of Immigrants from Dominica and percentage of population with ambulatory disability in the United States with a correlation coefficient (R) of -0.068 and weighted average of 6.9%, a difference of 17.7%.
Ambulatory Disability Correlation Summary
| Measurement | Immigrants from Morocco | Immigrants from Dominica |
| Minimum | 1.3% | 1.9% |
| Maximum | 12.4% | 12.5% |
| Range | 11.1% | 10.6% |
| Mean | 5.8% | 6.5% |
| Median | 5.6% | 6.8% |
| Interquartile 25% (IQ1) | 4.8% | 5.2% |
| Interquartile 75% (IQ3) | 6.0% | 7.8% |
| Interquartile Range (IQR) | 1.3% | 2.6% |
| Standard Deviation (Sample) | 2.5% | 2.2% |
| Standard Deviation (Population) | 2.4% | 2.2% |
Similar Demographics by Ambulatory Disability
Demographics Similar to Immigrants from Morocco by Ambulatory Disability
In terms of ambulatory disability, the demographic groups most similar to Immigrants from Morocco are Uruguayan (5.8%, a difference of 0.050%), Immigrants from Czechoslovakia (5.8%, a difference of 0.070%), Colombian (5.8%, a difference of 0.070%), Immigrants from Netherlands (5.8%, a difference of 0.080%), and New Zealander (5.8%, a difference of 0.18%).
| Demographics | Rating | Rank | Ambulatory Disability |
| Immigrants | Northern Europe | 98.2 /100 | #99 | Exceptional 5.8% |
| Immigrants | Serbia | 97.9 /100 | #100 | Exceptional 5.8% |
| Immigrants | South America | 97.9 /100 | #101 | Exceptional 5.8% |
| Immigrants | Kenya | 97.8 /100 | #102 | Exceptional 5.8% |
| Immigrants | Romania | 97.7 /100 | #103 | Exceptional 5.8% |
| New Zealanders | 97.6 /100 | #104 | Exceptional 5.8% |
| Immigrants | Czechoslovakia | 97.4 /100 | #105 | Exceptional 5.8% |
| Immigrants | Morocco | 97.3 /100 | #106 | Exceptional 5.8% |
| Uruguayans | 97.2 /100 | #107 | Exceptional 5.8% |
| Colombians | 97.2 /100 | #108 | Exceptional 5.8% |
| Immigrants | Netherlands | 97.1 /100 | #109 | Exceptional 5.8% |
| Immigrants | Colombia | 96.7 /100 | #110 | Exceptional 5.8% |
| Danes | 96.6 /100 | #111 | Exceptional 5.8% |
| South Africans | 96.3 /100 | #112 | Exceptional 5.9% |
| Immigrants | Uruguay | 95.6 /100 | #113 | Exceptional 5.9% |
Demographics Similar to Immigrants from Dominica by Ambulatory Disability
In terms of ambulatory disability, the demographic groups most similar to Immigrants from Dominica are Scotch-Irish (6.9%, a difference of 0.030%), West Indian (6.9%, a difference of 0.12%), Nonimmigrants (6.9%, a difference of 0.14%), Cheyenne (6.9%, a difference of 0.19%), and U.S. Virgin Islander (6.8%, a difference of 0.41%).
| Demographics | Rating | Rank | Ambulatory Disability |
| Barbadians | 0.0 /100 | #282 | Tragic 6.8% |
| Immigrants | Barbados | 0.0 /100 | #283 | Tragic 6.8% |
| Immigrants | Jamaica | 0.0 /100 | #284 | Tragic 6.8% |
| Fijians | 0.0 /100 | #285 | Tragic 6.8% |
| Yakama | 0.0 /100 | #286 | Tragic 6.8% |
| U.S. Virgin Islanders | 0.0 /100 | #287 | Tragic 6.8% |
| Immigrants | Nonimmigrants | 0.0 /100 | #288 | Tragic 6.9% |
| Immigrants | Dominica | 0.0 /100 | #289 | Tragic 6.9% |
| Scotch-Irish | 0.0 /100 | #290 | Tragic 6.9% |
| West Indians | 0.0 /100 | #291 | Tragic 6.9% |
| Cheyenne | 0.0 /100 | #292 | Tragic 6.9% |
| Immigrants | St. Vincent and the Grenadines | 0.0 /100 | #293 | Tragic 6.9% |
| Cape Verdeans | 0.0 /100 | #294 | Tragic 6.9% |
| Crow | 0.0 /100 | #295 | Tragic 6.9% |
| Alaskan Athabascans | 0.0 /100 | #296 | Tragic 6.9% |