Immigrants from Middle Africa vs Blackfeet Cognitive Disability
COMPARE
Immigrants from Middle Africa
Blackfeet
Cognitive Disability
Cognitive Disability Comparison
Immigrants from Middle Africa
Blackfeet
18.6%
COGNITIVE DISABILITY
0.0/ 100
METRIC RATING
316th/ 347
METRIC RANK
18.3%
COGNITIVE DISABILITY
0.0/ 100
METRIC RATING
297th/ 347
METRIC RANK
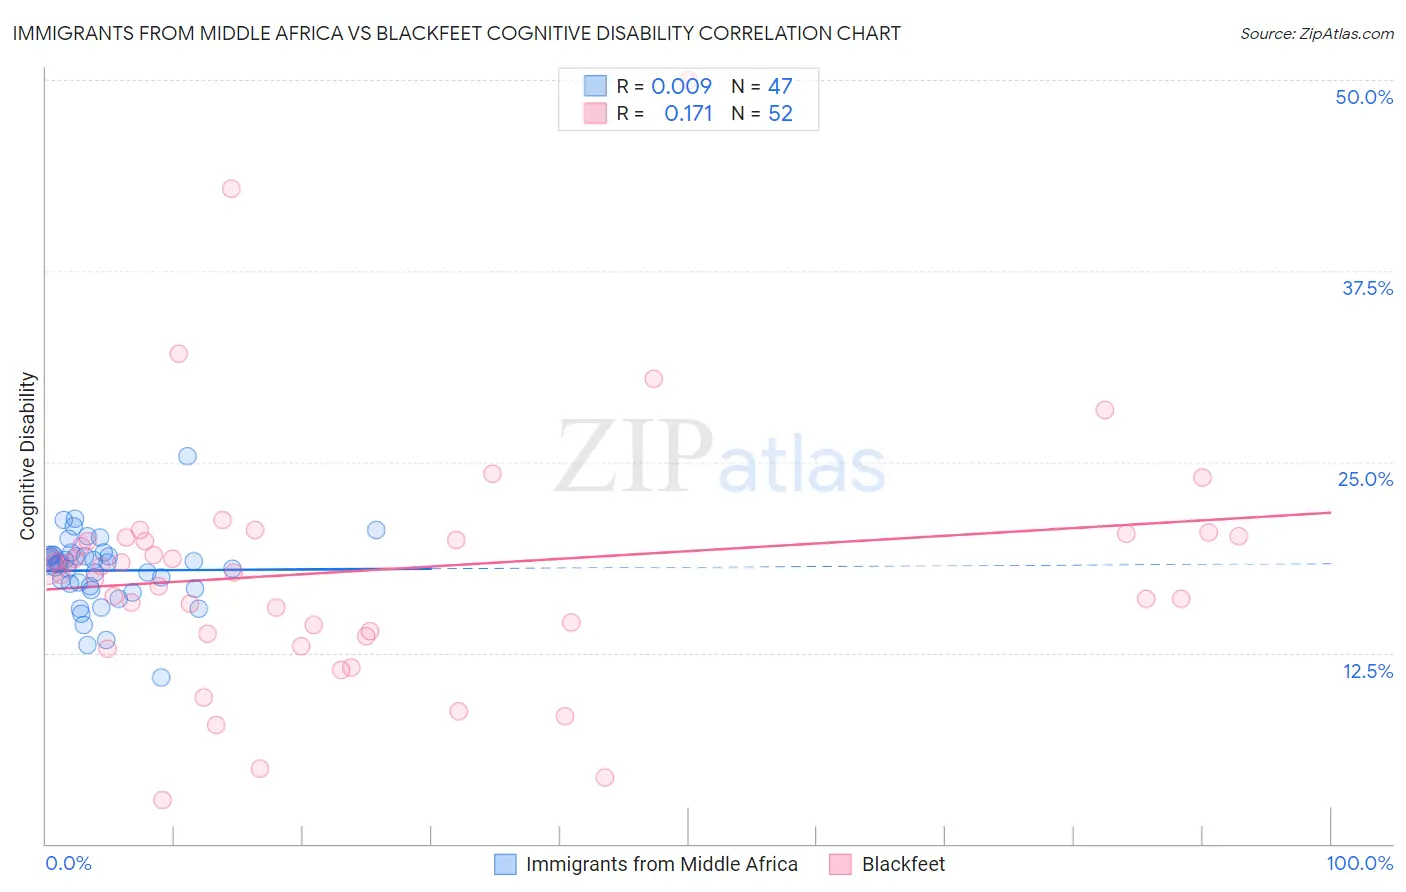
Immigrants from Middle Africa vs Blackfeet Cognitive Disability Correlation Chart
The statistical analysis conducted on geographies consisting of 202,719,317 people shows no correlation between the proportion of Immigrants from Middle Africa and percentage of population with cognitive disability in the United States with a correlation coefficient (R) of 0.009 and weighted average of 18.6%. Similarly, the statistical analysis conducted on geographies consisting of 309,516,270 people shows a poor positive correlation between the proportion of Blackfeet and percentage of population with cognitive disability in the United States with a correlation coefficient (R) of 0.171 and weighted average of 18.3%, a difference of 1.7%.
Cognitive Disability Correlation Summary
| Measurement | Immigrants from Middle Africa | Blackfeet |
| Minimum | 10.9% | 2.8% |
| Maximum | 25.3% | 50.0% |
| Range | 14.4% | 47.2% |
| Mean | 17.9% | 17.9% |
| Median | 18.4% | 18.0% |
| Interquartile 25% (IQ1) | 16.7% | 13.8% |
| Interquartile 75% (IQ3) | 18.9% | 20.1% |
| Interquartile Range (IQR) | 2.2% | 6.3% |
| Standard Deviation (Sample) | 2.4% | 8.2% |
| Standard Deviation (Population) | 2.4% | 8.1% |
Demographics Similar to Immigrants from Middle Africa and Blackfeet by Cognitive Disability
In terms of cognitive disability, the demographic groups most similar to Immigrants from Middle Africa are Immigrants from Dominica (18.6%, a difference of 0.080%), Subsaharan African (18.5%, a difference of 0.26%), Yaqui (18.5%, a difference of 0.32%), Chickasaw (18.5%, a difference of 0.43%), and Hmong (18.4%, a difference of 0.71%). Similarly, the demographic groups most similar to Blackfeet are Japanese (18.3%, a difference of 0.0%), Ghanaian (18.3%, a difference of 0.040%), Creek (18.3%, a difference of 0.060%), Immigrants from Burma/Myanmar (18.2%, a difference of 0.14%), and Immigrants from Ghana (18.3%, a difference of 0.20%).
| Demographics | Rating | Rank | Cognitive Disability |
| Immigrants | Burma/Myanmar | 0.0 /100 | #296 | Tragic 18.2% |
| Blackfeet | 0.0 /100 | #297 | Tragic 18.3% |
| Japanese | 0.0 /100 | #298 | Tragic 18.3% |
| Ghanaians | 0.0 /100 | #299 | Tragic 18.3% |
| Creek | 0.0 /100 | #300 | Tragic 18.3% |
| Immigrants | Ghana | 0.0 /100 | #301 | Tragic 18.3% |
| Barbadians | 0.0 /100 | #302 | Tragic 18.3% |
| Immigrants | Kenya | 0.0 /100 | #303 | Tragic 18.3% |
| Immigrants | Eritrea | 0.0 /100 | #304 | Tragic 18.3% |
| Colville | 0.0 /100 | #305 | Tragic 18.3% |
| Seminole | 0.0 /100 | #306 | Tragic 18.3% |
| Ugandans | 0.0 /100 | #307 | Tragic 18.3% |
| Immigrants | Western Africa | 0.0 /100 | #308 | Tragic 18.4% |
| Immigrants | Eastern Africa | 0.0 /100 | #309 | Tragic 18.4% |
| Choctaw | 0.0 /100 | #310 | Tragic 18.4% |
| Hmong | 0.0 /100 | #311 | Tragic 18.4% |
| Chickasaw | 0.0 /100 | #312 | Tragic 18.5% |
| Yaqui | 0.0 /100 | #313 | Tragic 18.5% |
| Sub-Saharan Africans | 0.0 /100 | #314 | Tragic 18.5% |
| Immigrants | Dominica | 0.0 /100 | #315 | Tragic 18.6% |
| Immigrants | Middle Africa | 0.0 /100 | #316 | Tragic 18.6% |