Immigrants from Middle Africa vs Yakama Vision Disability
COMPARE
Immigrants from Middle Africa
Yakama
Vision Disability
Vision Disability Comparison
Immigrants from Middle Africa
Yakama
2.2%
VISION DISABILITY
33.5/ 100
METRIC RATING
185th/ 347
METRIC RANK
2.5%
VISION DISABILITY
0.0/ 100
METRIC RATING
284th/ 347
METRIC RANK
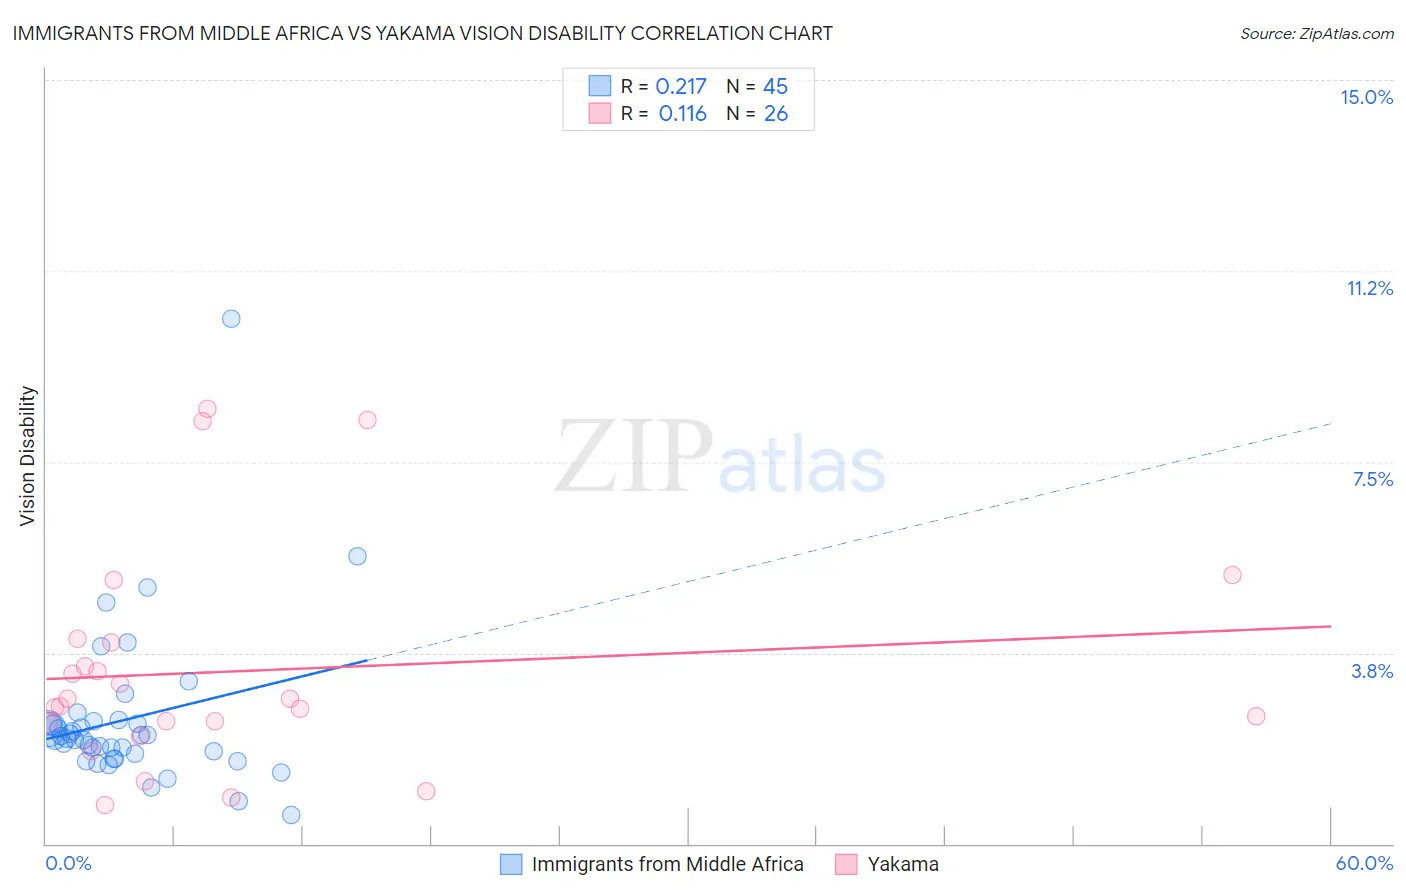
Immigrants from Middle Africa vs Yakama Vision Disability Correlation Chart
The statistical analysis conducted on geographies consisting of 202,642,272 people shows a weak positive correlation between the proportion of Immigrants from Middle Africa and percentage of population with vision disability in the United States with a correlation coefficient (R) of 0.217 and weighted average of 2.2%. Similarly, the statistical analysis conducted on geographies consisting of 19,916,701 people shows a poor positive correlation between the proportion of Yakama and percentage of population with vision disability in the United States with a correlation coefficient (R) of 0.116 and weighted average of 2.5%, a difference of 12.6%.
Vision Disability Correlation Summary
| Measurement | Immigrants from Middle Africa | Yakama |
| Minimum | 0.56% | 0.75% |
| Maximum | 10.3% | 8.5% |
| Range | 9.7% | 7.8% |
| Mean | 2.4% | 3.4% |
| Median | 2.1% | 2.8% |
| Interquartile 25% (IQ1) | 1.7% | 2.4% |
| Interquartile 75% (IQ3) | 2.4% | 3.9% |
| Interquartile Range (IQR) | 0.66% | 1.6% |
| Standard Deviation (Sample) | 1.6% | 2.2% |
| Standard Deviation (Population) | 1.5% | 2.1% |
Similar Demographics by Vision Disability
Demographics Similar to Immigrants from Middle Africa by Vision Disability
In terms of vision disability, the demographic groups most similar to Immigrants from Middle Africa are Native Hawaiian (2.2%, a difference of 0.020%), Moroccan (2.2%, a difference of 0.13%), Immigrants from St. Vincent and the Grenadines (2.2%, a difference of 0.23%), Immigrants from Burma/Myanmar (2.2%, a difference of 0.30%), and Guyanese (2.2%, a difference of 0.34%).
| Demographics | Rating | Rank | Vision Disability |
| Immigrants | Oceania | 45.1 /100 | #178 | Average 2.2% |
| Immigrants | North America | 44.5 /100 | #179 | Average 2.2% |
| Uruguayans | 42.7 /100 | #180 | Average 2.2% |
| Immigrants | Western Europe | 41.1 /100 | #181 | Average 2.2% |
| Costa Ricans | 40.7 /100 | #182 | Average 2.2% |
| Immigrants | Burma/Myanmar | 37.9 /100 | #183 | Fair 2.2% |
| Moroccans | 35.4 /100 | #184 | Fair 2.2% |
| Immigrants | Middle Africa | 33.5 /100 | #185 | Fair 2.2% |
| Native Hawaiians | 33.3 /100 | #186 | Fair 2.2% |
| Immigrants | St. Vincent and the Grenadines | 30.3 /100 | #187 | Fair 2.2% |
| Guyanese | 28.9 /100 | #188 | Fair 2.2% |
| Salvadorans | 27.4 /100 | #189 | Fair 2.2% |
| Immigrants | Costa Rica | 26.1 /100 | #190 | Fair 2.2% |
| Canadians | 25.8 /100 | #191 | Fair 2.2% |
| Europeans | 25.7 /100 | #192 | Fair 2.2% |
Demographics Similar to Yakama by Vision Disability
In terms of vision disability, the demographic groups most similar to Yakama are Immigrants from Central America (2.5%, a difference of 0.010%), Sioux (2.5%, a difference of 0.030%), Honduran (2.5%, a difference of 0.17%), French American Indian (2.5%, a difference of 0.19%), and Puget Sound Salish (2.5%, a difference of 0.28%).
| Demographics | Rating | Rank | Vision Disability |
| Bahamians | 0.0 /100 | #277 | Tragic 2.4% |
| Spanish | 0.0 /100 | #278 | Tragic 2.4% |
| Nepalese | 0.0 /100 | #279 | Tragic 2.4% |
| Cape Verdeans | 0.0 /100 | #280 | Tragic 2.4% |
| U.S. Virgin Islanders | 0.0 /100 | #281 | Tragic 2.5% |
| Immigrants | Caribbean | 0.0 /100 | #282 | Tragic 2.5% |
| Puget Sound Salish | 0.0 /100 | #283 | Tragic 2.5% |
| Yakama | 0.0 /100 | #284 | Tragic 2.5% |
| Immigrants | Central America | 0.0 /100 | #285 | Tragic 2.5% |
| Sioux | 0.0 /100 | #286 | Tragic 2.5% |
| Hondurans | 0.0 /100 | #287 | Tragic 2.5% |
| French American Indians | 0.0 /100 | #288 | Tragic 2.5% |
| Immigrants | Nonimmigrants | 0.0 /100 | #289 | Tragic 2.5% |
| Immigrants | Cuba | 0.0 /100 | #290 | Tragic 2.5% |
| Immigrants | Honduras | 0.0 /100 | #291 | Tragic 2.5% |