Immigrants from Kuwait vs Immigrants from Zaire Disability Age 65 to 74
COMPARE
Immigrants from Kuwait
Immigrants from Zaire
Disability Age 65 to 74
Disability Age 65 to 74 Comparison
Immigrants from Kuwait
Immigrants from Zaire
22.0%
DISABILITY AGE 65 TO 74
97.9/ 100
METRIC RATING
89th/ 347
METRIC RANK
24.3%
DISABILITY AGE 65 TO 74
5.0/ 100
METRIC RATING
232nd/ 347
METRIC RANK
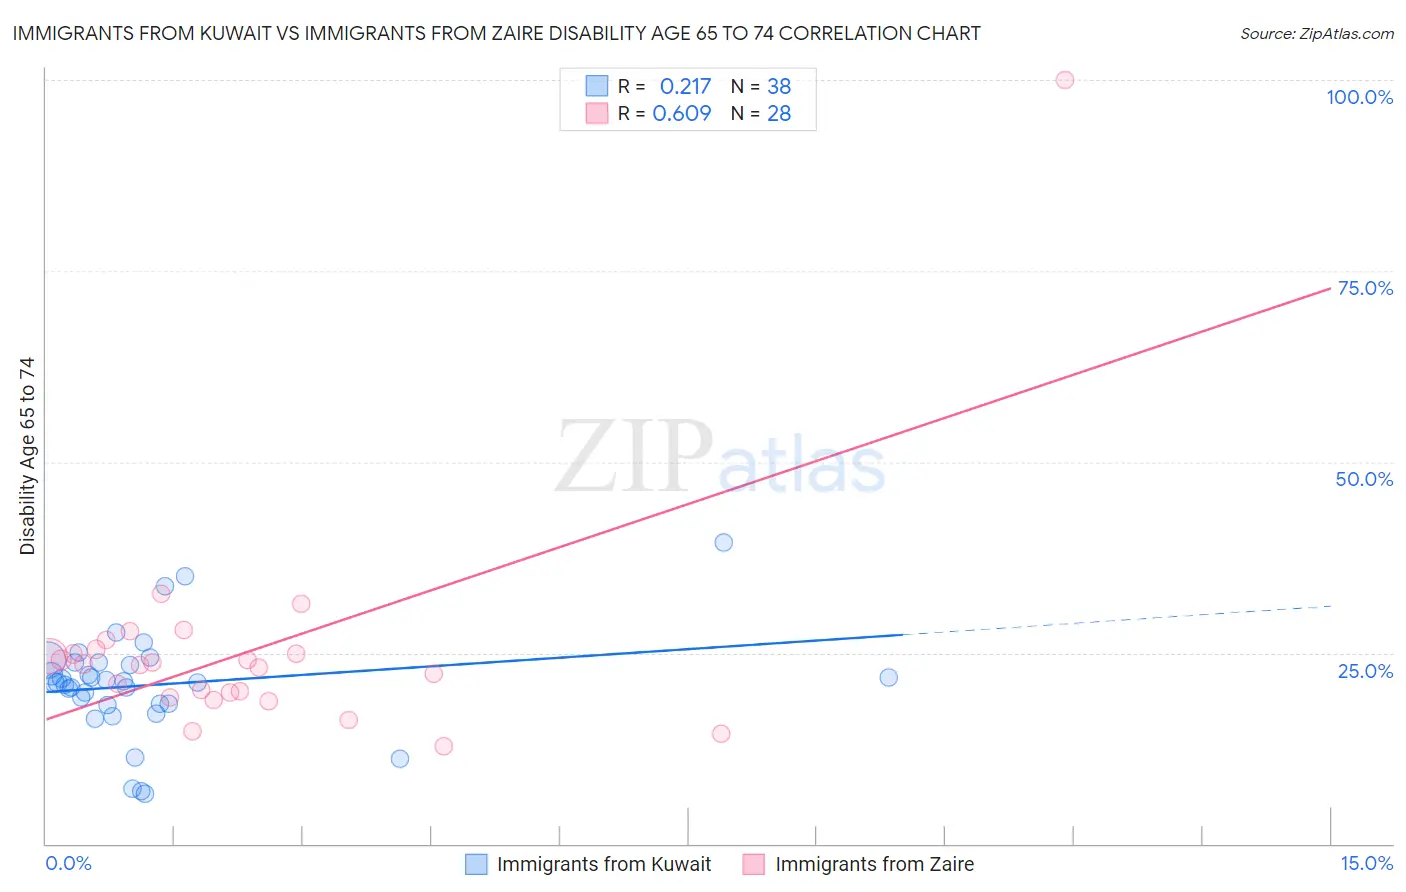
Immigrants from Kuwait vs Immigrants from Zaire Disability Age 65 to 74 Correlation Chart
The statistical analysis conducted on geographies consisting of 136,847,931 people shows a weak positive correlation between the proportion of Immigrants from Kuwait and percentage of population with a disability between the ages 65 and 75 in the United States with a correlation coefficient (R) of 0.217 and weighted average of 22.0%. Similarly, the statistical analysis conducted on geographies consisting of 107,234,290 people shows a significant positive correlation between the proportion of Immigrants from Zaire and percentage of population with a disability between the ages 65 and 75 in the United States with a correlation coefficient (R) of 0.609 and weighted average of 24.3%, a difference of 10.5%.
Disability Age 65 to 74 Correlation Summary
| Measurement | Immigrants from Kuwait | Immigrants from Zaire |
| Minimum | 6.6% | 12.7% |
| Maximum | 39.4% | 100.0% |
| Range | 32.8% | 87.3% |
| Mean | 20.8% | 25.2% |
| Median | 21.1% | 23.5% |
| Interquartile 25% (IQ1) | 18.4% | 19.5% |
| Interquartile 75% (IQ3) | 23.7% | 25.1% |
| Interquartile Range (IQR) | 5.3% | 5.7% |
| Standard Deviation (Sample) | 6.8% | 15.4% |
| Standard Deviation (Population) | 6.7% | 15.1% |
Similar Demographics by Disability Age 65 to 74
Demographics Similar to Immigrants from Kuwait by Disability Age 65 to 74
In terms of disability age 65 to 74, the demographic groups most similar to Immigrants from Kuwait are Immigrants from Netherlands (22.0%, a difference of 0.010%), Italian (22.0%, a difference of 0.010%), Australian (22.0%, a difference of 0.030%), Chilean (22.0%, a difference of 0.030%), and Polish (22.0%, a difference of 0.080%).
| Demographics | Rating | Rank | Disability Age 65 to 74 |
| Immigrants | Indonesia | 98.7 /100 | #82 | Exceptional 21.9% |
| Immigrants | Brazil | 98.5 /100 | #83 | Exceptional 21.9% |
| Immigrants | Spain | 98.5 /100 | #84 | Exceptional 21.9% |
| Immigrants | Lebanon | 98.4 /100 | #85 | Exceptional 21.9% |
| South Africans | 98.4 /100 | #86 | Exceptional 21.9% |
| Australians | 98.0 /100 | #87 | Exceptional 22.0% |
| Immigrants | Netherlands | 97.9 /100 | #88 | Exceptional 22.0% |
| Immigrants | Kuwait | 97.9 /100 | #89 | Exceptional 22.0% |
| Italians | 97.9 /100 | #90 | Exceptional 22.0% |
| Chileans | 97.9 /100 | #91 | Exceptional 22.0% |
| Poles | 97.8 /100 | #92 | Exceptional 22.0% |
| Immigrants | Canada | 97.8 /100 | #93 | Exceptional 22.1% |
| Immigrants | Chile | 97.7 /100 | #94 | Exceptional 22.1% |
| Romanians | 97.7 /100 | #95 | Exceptional 22.1% |
| Immigrants | North America | 97.5 /100 | #96 | Exceptional 22.1% |
Demographics Similar to Immigrants from Zaire by Disability Age 65 to 74
In terms of disability age 65 to 74, the demographic groups most similar to Immigrants from Zaire are Immigrants from Thailand (24.3%, a difference of 0.050%), Bahamian (24.4%, a difference of 0.16%), Barbadian (24.3%, a difference of 0.25%), Panamanian (24.4%, a difference of 0.27%), and Celtic (24.2%, a difference of 0.36%).
| Demographics | Rating | Rank | Disability Age 65 to 74 |
| Bermudans | 8.2 /100 | #225 | Tragic 24.2% |
| Iraqis | 8.1 /100 | #226 | Tragic 24.2% |
| Nigerians | 7.8 /100 | #227 | Tragic 24.2% |
| Whites/Caucasians | 6.6 /100 | #228 | Tragic 24.2% |
| Celtics | 6.4 /100 | #229 | Tragic 24.2% |
| Barbadians | 6.0 /100 | #230 | Tragic 24.3% |
| Immigrants | Thailand | 5.2 /100 | #231 | Tragic 24.3% |
| Immigrants | Zaire | 5.0 /100 | #232 | Tragic 24.3% |
| Bahamians | 4.5 /100 | #233 | Tragic 24.4% |
| Panamanians | 4.2 /100 | #234 | Tragic 24.4% |
| Scotch-Irish | 3.8 /100 | #235 | Tragic 24.4% |
| German Russians | 3.7 /100 | #236 | Tragic 24.4% |
| West Indians | 3.4 /100 | #237 | Tragic 24.5% |
| Immigrants | Ghana | 3.0 /100 | #238 | Tragic 24.5% |
| Immigrants | Caribbean | 2.6 /100 | #239 | Tragic 24.6% |