Immigrants from Belgium vs Immigrants from Zaire Disability Age 65 to 74

COMPARE

Immigrants from Belgium
Race
Ancestry
AfghanAfricanAlaska NativeAlaskan AthabascanAlbanianAleutAlsatianAmericanApacheArabArapahoArgentineanArmenianAssyrian/Chaldean/SyriacAustralianAustrianBahamianBangladeshiBarbadianBasqueBelgianBelizeanBermudanBhutaneseBlackfeetBolivianBrazilianBritishBritish West IndianBulgarianBurmeseCajunCambodianCanadianCape VerdeanCarpatho RusynCelticCentral AmericanCentral American IndianCherokeeCheyenneChickasawChileanChineseChippewaChoctawColombianColvilleComancheCosta RicanCreeCreekCroatianCrowCubanCypriotCzechCzechoslovakianDanishDelawareDominicanDutchDutch West IndianEastern EuropeanEcuadorianEgyptianEnglishEstonianEthiopianEuropeanFijianFilipinoFinnishFrenchFrench American IndianFrench CanadianGermanGerman RussianGhanaianGreekGuamanian/ChamorroGuatemalanGuyaneseHaitianHmongHonduranHopiHoumaHungarianIcelanderIndian (Asian)IndonesianInupiatIranianIraqiIrishIroquoisIsraeliItalianJamaicanJapaneseJordanianKenyanKiowaKoreanLaotianLatvianLebaneseLiberianLithuanianLumbeeLuxembourgerMacedonianMalaysianMalteseMarshalleseMenomineeMexicanMexican American IndianMongolianMoroccanNative HawaiianNavajoNepaleseNew ZealanderNicaraguanNigerianNorthern EuropeanNorwegianOkinawanOsageOttawaPaiutePakistaniPalestinianPanamanianParaguayanPennsylvania GermanPeruvianPimaPolishPortuguesePotawatomiPuebloPuerto RicanPuget Sound SalishRomanianRussianSalvadoranSamoanScandinavianScotch-IrishScottishSeminoleSenegaleseSerbianShoshoneSierra LeoneanSiouxSlavicSlovakSloveneSomaliSouth AfricanSouth AmericanSouth American IndianSoviet UnionSpaniardSpanishSpanish AmericanSpanish American IndianSri LankanSubsaharan AfricanSudaneseSwedishSwissSyrianTaiwaneseThaiTlingit-HaidaTohono O'OdhamTonganTrinidadian and TobagonianTsimshianTurkishU.S. Virgin IslanderUgandanUkrainianUruguayanUteVenezuelanVietnameseWelshWest IndianYakamaYaquiYugoslavianYumanYup'ikZimbabwean
Immigration
NonimmigrantsImmigrantsAfghanistanAfricaAlbaniaArgentinaArmeniaAsiaAustraliaAustriaBahamasBangladeshBarbadosBelarusBelgiumBelizeBoliviaBosnia and HerzegovinaBrazilBulgariaBurma/MyanmarCabo VerdeCambodiaCameroonCanadaCaribbeanCentral AmericaChileChinaColombiaCongoCosta RicaCroatiaCubaCzechoslovakiaDenmarkDominicaDominican RepublicEastern AfricaEastern AsiaEastern EuropeEcuadorEgyptEl SalvadorEnglandEritreaEthiopiaEuropeFijiFranceGermanyGhanaGreeceGrenadaGuatemalaGuyanaHaitiHondurasHong KongHungaryIndiaIndonesiaIranIraqIrelandIsraelItalyJamaicaJapanJordanKazakhstanKenyaKoreaKuwaitLaosLatin AmericaLatviaLebanonLiberiaLithuaniaMalaysiaMexicoMicronesiaMiddle AfricaMoldovaMoroccoNepalNetherlandsNicaraguaNigeriaNorth AmericaNorth MacedoniaNorthern AfricaNorthern EuropeNorwayOceaniaPakistanPanamaPeruPhilippinesPolandPortugalRomaniaRussiaSaudi ArabiaScotlandSenegalSerbiaSierra LeoneSingaporeSomaliaSouth AfricaSouth AmericaSouth Central AsiaSouth Eastern AsiaSouthern EuropeSpainSri LankaSt. Vincent and the GrenadinesSudanSwedenSwitzerlandSyriaTaiwanThailandTrinidad and TobagoTurkeyUgandaUkraineUruguayUzbekistanVenezuelaVietnamWest IndiesWestern AfricaWestern AsiaWestern EuropeYemenZimbabweAzores
Immigrants from Zaire
Race
Ancestry
AfghanAfricanAlaska NativeAlaskan AthabascanAlbanianAleutAlsatianAmericanApacheArabArapahoArgentineanArmenianAssyrian/Chaldean/SyriacAustralianAustrianBahamianBangladeshiBarbadianBasqueBelgianBelizeanBermudanBhutaneseBlackfeetBolivianBrazilianBritishBritish West IndianBulgarianBurmeseCajunCambodianCanadianCape VerdeanCarpatho RusynCelticCentral AmericanCentral American IndianCherokeeCheyenneChickasawChileanChineseChippewaChoctawColombianColvilleComancheCosta RicanCreeCreekCroatianCrowCubanCypriotCzechCzechoslovakianDanishDelawareDominicanDutchDutch West IndianEastern EuropeanEcuadorianEgyptianEnglishEstonianEthiopianEuropeanFijianFilipinoFinnishFrenchFrench American IndianFrench CanadianGermanGerman RussianGhanaianGreekGuamanian/ChamorroGuatemalanGuyaneseHaitianHmongHonduranHopiHoumaHungarianIcelanderIndian (Asian)IndonesianInupiatIranianIraqiIrishIroquoisIsraeliItalianJamaicanJapaneseJordanianKenyanKiowaKoreanLaotianLatvianLebaneseLiberianLithuanianLumbeeLuxembourgerMacedonianMalaysianMalteseMarshalleseMenomineeMexicanMexican American IndianMongolianMoroccanNative HawaiianNavajoNepaleseNew ZealanderNicaraguanNigerianNorthern EuropeanNorwegianOkinawanOsageOttawaPaiutePakistaniPalestinianPanamanianParaguayanPennsylvania GermanPeruvianPimaPolishPortuguesePotawatomiPuebloPuerto RicanPuget Sound SalishRomanianRussianSalvadoranSamoanScandinavianScotch-IrishScottishSeminoleSenegaleseSerbianShoshoneSierra LeoneanSiouxSlavicSlovakSloveneSomaliSouth AfricanSouth AmericanSouth American IndianSoviet UnionSpaniardSpanishSpanish AmericanSpanish American IndianSri LankanSubsaharan AfricanSudaneseSwedishSwissSyrianTaiwaneseThaiTlingit-HaidaTohono O'OdhamTonganTrinidadian and TobagonianTsimshianTurkishU.S. Virgin IslanderUgandanUkrainianUruguayanUteVenezuelanVietnameseWelshWest IndianYakamaYaquiYugoslavianYumanYup'ikZimbabwean
Immigration
NonimmigrantsImmigrantsAfghanistanAfricaAlbaniaArgentinaArmeniaAsiaAustraliaAustriaBahamasBangladeshBarbadosBelarusBelizeBoliviaBosnia and HerzegovinaBrazilBulgariaBurma/MyanmarCabo VerdeCambodiaCameroonCanadaCaribbeanCentral AmericaChileChinaColombiaCongoCosta RicaCroatiaCubaCzechoslovakiaDenmarkDominicaDominican RepublicEastern AfricaEastern AsiaEastern EuropeEcuadorEgyptEl SalvadorEnglandEritreaEthiopiaEuropeFijiFranceGermanyGhanaGreeceGrenadaGuatemalaGuyanaHaitiHondurasHong KongHungaryIndiaIndonesiaIranIraqIrelandIsraelItalyJamaicaJapanJordanKazakhstanKenyaKoreaKuwaitLaosLatin AmericaLatviaLebanonLiberiaLithuaniaMalaysiaMexicoMicronesiaMiddle AfricaMoldovaMoroccoNepalNetherlandsNicaraguaNigeriaNorth AmericaNorth MacedoniaNorthern AfricaNorthern EuropeNorwayOceaniaPakistanPanamaPeruPhilippinesPolandPortugalRomaniaRussiaSaudi ArabiaScotlandSenegalSerbiaSierra LeoneSingaporeSomaliaSouth AfricaSouth AmericaSouth Central AsiaSouth Eastern AsiaSouthern EuropeSpainSri LankaSt. Vincent and the GrenadinesSudanSwedenSwitzerlandSyriaTaiwanThailandTrinidad and TobagoTurkeyUgandaUkraineUruguayUzbekistanVenezuelaVietnamWest IndiesWestern AfricaWestern AsiaWestern EuropeYemenZaireZimbabweAzores
Disability Age 65 to 74
Income
Poverty
Unemployment
Labor Participation
Family Structure
Vehicle Availability
Education Level
Disability

Disability Age 65 to 74 Comparison

Immigrants from Belgium

Immigrants from Zaire

Exceptional
Tragic
21.0%
DISABILITY AGE 65 TO 74
99.9/ 100
METRIC RATING
23rd/ 347
METRIC RANK
24.3%
DISABILITY AGE 65 TO 74
5.0/ 100
METRIC RATING
232nd/ 347
METRIC RANK

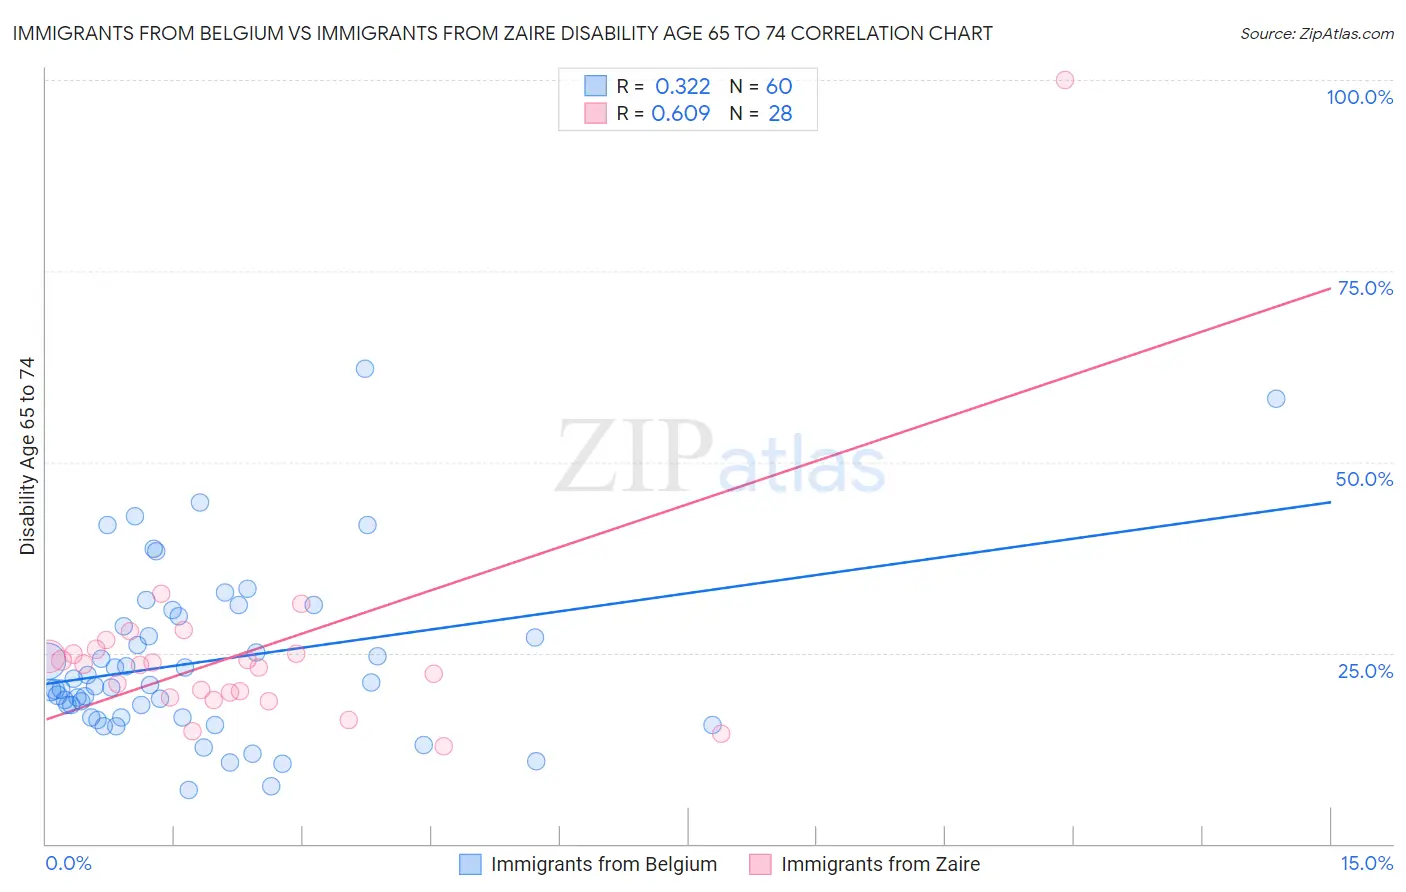
Immigrants from Belgium vs Immigrants from Zaire Disability Age 65 to 74 Correlation Chart

The statistical analysis conducted on geographies consisting of 146,630,596 people shows a mild positive correlation between the proportion of Immigrants from Belgium and percentage of population with a disability between the ages 65 and 75 in the United States with a correlation coefficient (R) of 0.322 and weighted average of 21.0%. Similarly, the statistical analysis conducted on geographies consisting of 107,234,290 people shows a significant positive correlation between the proportion of Immigrants from Zaire and percentage of population with a disability between the ages 65 and 75 in the United States with a correlation coefficient (R) of 0.609 and weighted average of 24.3%, a difference of 16.2%.
Immigrants from Belgium vs Immigrants from Zaire Disability Age 65 to 74

Disability Age 65 to 74 Correlation Summary

MeasurementImmigrants from BelgiumImmigrants from Zaire
Minimum7.0%12.7%
Maximum62.2%100.0%
Range55.2%87.3%
Mean23.9%25.2%
Median20.7%23.5%
Interquartile 25% (IQ1)16.6%19.5%
Interquartile 75% (IQ3)29.1%25.1%
Interquartile Range (IQR)12.6%5.7%
Standard Deviation (Sample)11.1%15.4%
Standard Deviation (Population)11.0%15.1%

Similar Demographics by Disability Age 65 to 74

Demographics Similar to Immigrants from Belgium by Disability Age 65 to 74

In terms of disability age 65 to 74, the demographic groups most similar to Immigrants from Belgium are Soviet Union (21.0%, a difference of 0.050%), Bolivian (21.0%, a difference of 0.090%), Immigrants from Australia (21.0%, a difference of 0.11%), Immigrants from Sweden (21.0%, a difference of 0.12%), and Immigrants from Czechoslovakia (21.0%, a difference of 0.22%).
DemographicsRating | RankDisability Age 65 to 74
Immigrants | Lithuania
100.0
/100
|
#16
Exceptional
20.5%
Immigrants | South Central Asia
100.0
/100
|
#17
Exceptional
20.6%
Eastern Europeans
100.0
/100
|
#18
Exceptional
20.6%
Burmese
100.0
/100
|
#19
Exceptional
20.6%
Okinawans
100.0
/100
|
#20
Exceptional
20.7%
Immigrants | Bolivia
99.9
/100
|
#21
Exceptional
20.8%
Immigrants | Iran
99.9
/100
|
#22
Exceptional
20.9%
Immigrants | Belgium
99.9
/100
|
#23
Exceptional
21.0%
Soviet Union
99.9
/100
|
#24
Exceptional
21.0%
Bolivians
99.9
/100
|
#25
Exceptional
21.0%
Immigrants | Australia
99.9
/100
|
#26
Exceptional
21.0%
Immigrants | Sweden
99.9
/100
|
#27
Exceptional
21.0%
Immigrants | Czechoslovakia
99.9
/100
|
#28
Exceptional
21.0%
Immigrants | Japan
99.9
/100
|
#29
Exceptional
21.0%
Immigrants | Greece
99.9
/100
|
#30
Exceptional
21.0%

Demographics Similar to Immigrants from Zaire by Disability Age 65 to 74

In terms of disability age 65 to 74, the demographic groups most similar to Immigrants from Zaire are Immigrants from Thailand (24.3%, a difference of 0.050%), Bahamian (24.4%, a difference of 0.16%), Barbadian (24.3%, a difference of 0.25%), Panamanian (24.4%, a difference of 0.27%), and Celtic (24.2%, a difference of 0.36%).
DemographicsRating | RankDisability Age 65 to 74
Bermudans
8.2
/100
|
#225
Tragic
24.2%
Iraqis
8.1
/100
|
#226
Tragic
24.2%
Nigerians
7.8
/100
|
#227
Tragic
24.2%
Whites/Caucasians
6.6
/100
|
#228
Tragic
24.2%
Celtics
6.4
/100
|
#229
Tragic
24.2%
Barbadians
6.0
/100
|
#230
Tragic
24.3%
Immigrants | Thailand
5.2
/100
|
#231
Tragic
24.3%
Immigrants | Zaire
5.0
/100
|
#232
Tragic
24.3%
Bahamians
4.5
/100
|
#233
Tragic
24.4%
Panamanians
4.2
/100
|
#234
Tragic
24.4%
Scotch-Irish
3.8
/100
|
#235
Tragic
24.4%
German Russians
3.7
/100
|
#236
Tragic
24.4%
West Indians
3.4
/100
|
#237
Tragic
24.5%
Immigrants | Ghana
3.0
/100
|
#238
Tragic
24.5%
Immigrants | Caribbean
2.6
/100
|
#239
Tragic
24.6%