Immigrants from Kuwait vs Immigrants from South Africa Cognitive Disability
COMPARE
Immigrants from Kuwait
Immigrants from South Africa
Cognitive Disability
Cognitive Disability Comparison
Immigrants from Kuwait
Immigrants from South Africa
18.1%
COGNITIVE DISABILITY
0.2/ 100
METRIC RATING
277th/ 347
METRIC RANK
16.7%
COGNITIVE DISABILITY
99.0/ 100
METRIC RATING
86th/ 347
METRIC RANK
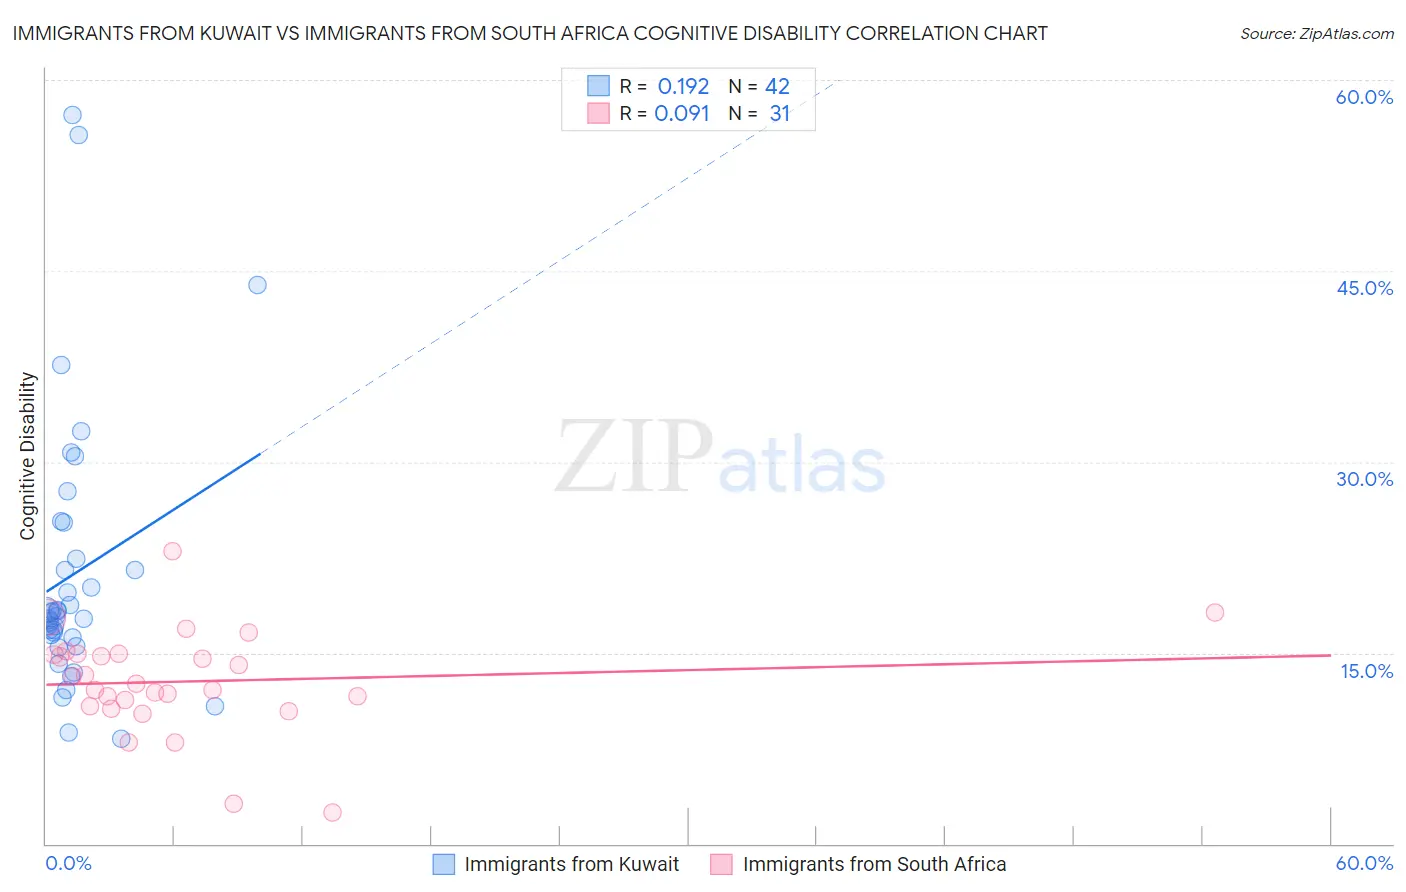
Immigrants from Kuwait vs Immigrants from South Africa Cognitive Disability Correlation Chart
The statistical analysis conducted on geographies consisting of 136,916,630 people shows a poor positive correlation between the proportion of Immigrants from Kuwait and percentage of population with cognitive disability in the United States with a correlation coefficient (R) of 0.192 and weighted average of 18.1%. Similarly, the statistical analysis conducted on geographies consisting of 233,312,895 people shows a slight positive correlation between the proportion of Immigrants from South Africa and percentage of population with cognitive disability in the United States with a correlation coefficient (R) of 0.091 and weighted average of 16.7%, a difference of 8.2%.
Cognitive Disability Correlation Summary
| Measurement | Immigrants from Kuwait | Immigrants from South Africa |
| Minimum | 8.3% | 2.5% |
| Maximum | 57.2% | 23.0% |
| Range | 49.0% | 20.5% |
| Mean | 21.2% | 12.7% |
| Median | 18.0% | 12.6% |
| Interquartile 25% (IQ1) | 16.2% | 10.8% |
| Interquartile 75% (IQ3) | 22.4% | 14.9% |
| Interquartile Range (IQR) | 6.3% | 4.1% |
| Standard Deviation (Sample) | 10.8% | 4.1% |
| Standard Deviation (Population) | 10.6% | 4.0% |
Similar Demographics by Cognitive Disability
Demographics Similar to Immigrants from Kuwait by Cognitive Disability
In terms of cognitive disability, the demographic groups most similar to Immigrants from Kuwait are Yuman (18.1%, a difference of 0.0%), Immigrants from Micronesia (18.1%, a difference of 0.010%), Immigrants from Laos (18.1%, a difference of 0.050%), Chippewa (18.1%, a difference of 0.060%), and West Indian (18.1%, a difference of 0.070%).
| Demographics | Rating | Rank | Cognitive Disability |
| Immigrants | Bahamas | 0.3 /100 | #270 | Tragic 18.0% |
| Potawatomi | 0.2 /100 | #271 | Tragic 18.0% |
| Immigrants | Honduras | 0.2 /100 | #272 | Tragic 18.0% |
| Immigrants | Nepal | 0.2 /100 | #273 | Tragic 18.0% |
| Immigrants | Nigeria | 0.2 /100 | #274 | Tragic 18.0% |
| Immigrants | Laos | 0.2 /100 | #275 | Tragic 18.1% |
| Yuman | 0.2 /100 | #276 | Tragic 18.1% |
| Immigrants | Kuwait | 0.2 /100 | #277 | Tragic 18.1% |
| Immigrants | Micronesia | 0.2 /100 | #278 | Tragic 18.1% |
| Chippewa | 0.1 /100 | #279 | Tragic 18.1% |
| West Indians | 0.1 /100 | #280 | Tragic 18.1% |
| Yakama | 0.1 /100 | #281 | Tragic 18.1% |
| Immigrants | Cambodia | 0.1 /100 | #282 | Tragic 18.1% |
| Nigerians | 0.1 /100 | #283 | Tragic 18.1% |
| Immigrants | Uganda | 0.1 /100 | #284 | Tragic 18.1% |
Demographics Similar to Immigrants from South Africa by Cognitive Disability
In terms of cognitive disability, the demographic groups most similar to Immigrants from South Africa are Native Hawaiian (16.7%, a difference of 0.010%), Immigrants from Moldova (16.7%, a difference of 0.030%), Belgian (16.7%, a difference of 0.050%), Serbian (16.7%, a difference of 0.070%), and Immigrants from Philippines (16.7%, a difference of 0.070%).
| Demographics | Rating | Rank | Cognitive Disability |
| Immigrants | Bulgaria | 99.3 /100 | #79 | Exceptional 16.7% |
| Egyptians | 99.2 /100 | #80 | Exceptional 16.7% |
| Immigrants | Netherlands | 99.2 /100 | #81 | Exceptional 16.7% |
| Swiss | 99.2 /100 | #82 | Exceptional 16.7% |
| Serbians | 99.1 /100 | #83 | Exceptional 16.7% |
| Belgians | 99.1 /100 | #84 | Exceptional 16.7% |
| Immigrants | Moldova | 99.1 /100 | #85 | Exceptional 16.7% |
| Immigrants | South Africa | 99.0 /100 | #86 | Exceptional 16.7% |
| Native Hawaiians | 99.0 /100 | #87 | Exceptional 16.7% |
| Immigrants | Philippines | 99.0 /100 | #88 | Exceptional 16.7% |
| Immigrants | Egypt | 98.8 /100 | #89 | Exceptional 16.7% |
| South Americans | 98.8 /100 | #90 | Exceptional 16.7% |
| Danes | 98.8 /100 | #91 | Exceptional 16.7% |
| Immigrants | South America | 98.8 /100 | #92 | Exceptional 16.7% |
| Immigrants | Southern Europe | 98.7 /100 | #93 | Exceptional 16.7% |