Immigrants from Korea vs West Indian Disability Age 65 to 74
COMPARE
Immigrants from Korea
West Indian
Disability Age 65 to 74
Disability Age 65 to 74 Comparison
Immigrants from Korea
West Indians
20.4%
DISABILITY AGE 65 TO 74
100.0/ 100
METRIC RATING
12th/ 347
METRIC RANK
24.5%
DISABILITY AGE 65 TO 74
3.4/ 100
METRIC RATING
237th/ 347
METRIC RANK
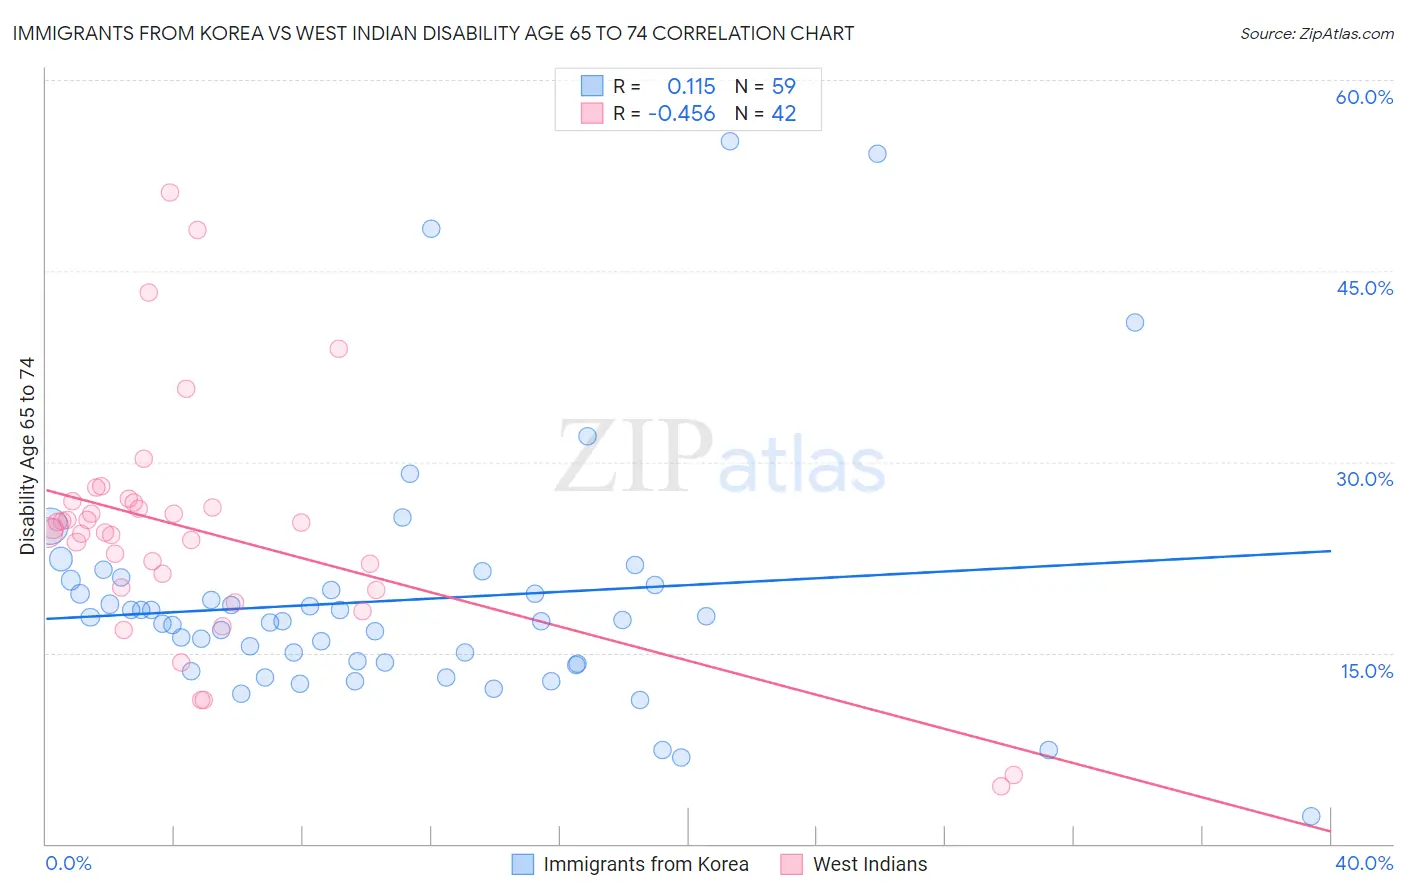
Immigrants from Korea vs West Indian Disability Age 65 to 74 Correlation Chart
The statistical analysis conducted on geographies consisting of 415,254,221 people shows a poor positive correlation between the proportion of Immigrants from Korea and percentage of population with a disability between the ages 65 and 75 in the United States with a correlation coefficient (R) of 0.115 and weighted average of 20.4%. Similarly, the statistical analysis conducted on geographies consisting of 253,647,264 people shows a moderate negative correlation between the proportion of West Indians and percentage of population with a disability between the ages 65 and 75 in the United States with a correlation coefficient (R) of -0.456 and weighted average of 24.5%, a difference of 20.2%.
Disability Age 65 to 74 Correlation Summary
| Measurement | Immigrants from Korea | West Indian |
| Minimum | 2.2% | 4.5% |
| Maximum | 55.2% | 51.2% |
| Range | 53.1% | 46.7% |
| Mean | 19.1% | 24.6% |
| Median | 17.5% | 24.6% |
| Interquartile 25% (IQ1) | 14.2% | 20.1% |
| Interquartile 75% (IQ3) | 20.4% | 26.8% |
| Interquartile Range (IQR) | 6.2% | 6.7% |
| Standard Deviation (Sample) | 9.8% | 9.3% |
| Standard Deviation (Population) | 9.7% | 9.1% |
Similar Demographics by Disability Age 65 to 74
Demographics Similar to Immigrants from Korea by Disability Age 65 to 74
In terms of disability age 65 to 74, the demographic groups most similar to Immigrants from Korea are Immigrants from Ireland (20.3%, a difference of 0.21%), Immigrants from Eastern Asia (20.3%, a difference of 0.37%), Immigrants from Singapore (20.4%, a difference of 0.38%), Immigrants from China (20.3%, a difference of 0.45%), and Indian (Asian) (20.5%, a difference of 0.86%).
| Demographics | Rating | Rank | Disability Age 65 to 74 |
| Immigrants | Israel | 100.0 /100 | #5 | Exceptional 19.9% |
| Iranians | 100.0 /100 | #6 | Exceptional 19.9% |
| Cypriots | 100.0 /100 | #7 | Exceptional 20.1% |
| Thais | 100.0 /100 | #8 | Exceptional 20.1% |
| Immigrants | China | 100.0 /100 | #9 | Exceptional 20.3% |
| Immigrants | Eastern Asia | 100.0 /100 | #10 | Exceptional 20.3% |
| Immigrants | Ireland | 100.0 /100 | #11 | Exceptional 20.3% |
| Immigrants | Korea | 100.0 /100 | #12 | Exceptional 20.4% |
| Immigrants | Singapore | 100.0 /100 | #13 | Exceptional 20.4% |
| Indians (Asian) | 100.0 /100 | #14 | Exceptional 20.5% |
| Paraguayans | 100.0 /100 | #15 | Exceptional 20.5% |
| Immigrants | Lithuania | 100.0 /100 | #16 | Exceptional 20.5% |
| Immigrants | South Central Asia | 100.0 /100 | #17 | Exceptional 20.6% |
| Eastern Europeans | 100.0 /100 | #18 | Exceptional 20.6% |
| Burmese | 100.0 /100 | #19 | Exceptional 20.6% |
Demographics Similar to West Indians by Disability Age 65 to 74
In terms of disability age 65 to 74, the demographic groups most similar to West Indians are German Russian (24.4%, a difference of 0.10%), Scotch-Irish (24.4%, a difference of 0.14%), Immigrants from Ghana (24.5%, a difference of 0.17%), Panamanian (24.4%, a difference of 0.29%), and Immigrants from Caribbean (24.6%, a difference of 0.39%).
| Demographics | Rating | Rank | Disability Age 65 to 74 |
| Barbadians | 6.0 /100 | #230 | Tragic 24.3% |
| Immigrants | Thailand | 5.2 /100 | #231 | Tragic 24.3% |
| Immigrants | Zaire | 5.0 /100 | #232 | Tragic 24.3% |
| Bahamians | 4.5 /100 | #233 | Tragic 24.4% |
| Panamanians | 4.2 /100 | #234 | Tragic 24.4% |
| Scotch-Irish | 3.8 /100 | #235 | Tragic 24.4% |
| German Russians | 3.7 /100 | #236 | Tragic 24.4% |
| West Indians | 3.4 /100 | #237 | Tragic 24.5% |
| Immigrants | Ghana | 3.0 /100 | #238 | Tragic 24.5% |
| Immigrants | Caribbean | 2.6 /100 | #239 | Tragic 24.6% |
| Spaniards | 2.4 /100 | #240 | Tragic 24.6% |
| Immigrants | Western Africa | 2.3 /100 | #241 | Tragic 24.6% |
| Immigrants | Senegal | 2.2 /100 | #242 | Tragic 24.6% |
| Spanish | 2.2 /100 | #243 | Tragic 24.6% |
| Armenians | 2.0 /100 | #244 | Tragic 24.7% |