Immigrants from Italy vs Basque Hearing Disability
COMPARE
Immigrants from Italy
Basque
Hearing Disability
Hearing Disability Comparison
Immigrants from Italy
Basques
3.0%
HEARING DISABILITY
41.1/ 100
METRIC RATING
182nd/ 347
METRIC RANK
3.6%
HEARING DISABILITY
0.0/ 100
METRIC RATING
278th/ 347
METRIC RANK
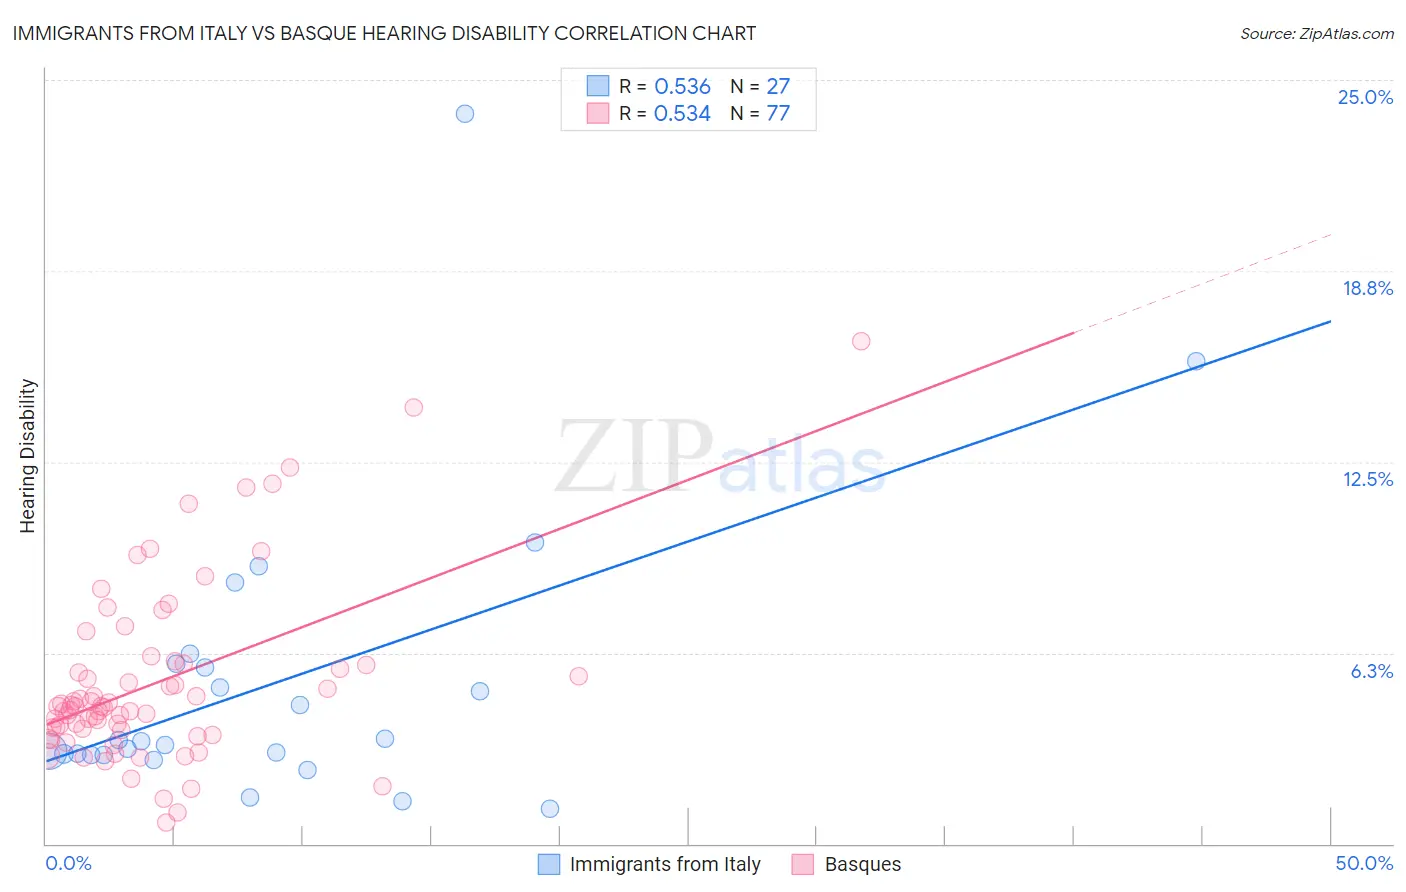
Immigrants from Italy vs Basque Hearing Disability Correlation Chart
The statistical analysis conducted on geographies consisting of 324,155,277 people shows a substantial positive correlation between the proportion of Immigrants from Italy and percentage of population with hearing disability in the United States with a correlation coefficient (R) of 0.536 and weighted average of 3.0%. Similarly, the statistical analysis conducted on geographies consisting of 165,769,952 people shows a substantial positive correlation between the proportion of Basques and percentage of population with hearing disability in the United States with a correlation coefficient (R) of 0.534 and weighted average of 3.6%, a difference of 19.0%.
Hearing Disability Correlation Summary
| Measurement | Immigrants from Italy | Basque |
| Minimum | 1.1% | 0.68% |
| Maximum | 23.9% | 16.4% |
| Range | 22.8% | 15.7% |
| Mean | 5.3% | 5.3% |
| Median | 3.3% | 4.5% |
| Interquartile 25% (IQ1) | 2.9% | 3.6% |
| Interquartile 75% (IQ3) | 5.9% | 5.9% |
| Interquartile Range (IQR) | 3.0% | 2.2% |
| Standard Deviation (Sample) | 4.9% | 2.9% |
| Standard Deviation (Population) | 4.8% | 2.9% |
Similar Demographics by Hearing Disability
Demographics Similar to Immigrants from Italy by Hearing Disability
In terms of hearing disability, the demographic groups most similar to Immigrants from Italy are Immigrants from Belgium (3.0%, a difference of 0.030%), Immigrants from Sweden (3.0%, a difference of 0.12%), Bulgarian (3.0%, a difference of 0.14%), Immigrants from Moldova (3.0%, a difference of 0.18%), and Immigrants from Ireland (3.0%, a difference of 0.37%).
| Demographics | Rating | Rank | Hearing Disability |
| Immigrants | Romania | 48.4 /100 | #175 | Average 3.0% |
| Panamanians | 47.0 /100 | #176 | Average 3.0% |
| Immigrants | Philippines | 46.4 /100 | #177 | Average 3.0% |
| Japanese | 46.0 /100 | #178 | Average 3.0% |
| Immigrants | Moldova | 43.1 /100 | #179 | Average 3.0% |
| Immigrants | Sweden | 42.4 /100 | #180 | Average 3.0% |
| Immigrants | Belgium | 41.5 /100 | #181 | Average 3.0% |
| Immigrants | Italy | 41.1 /100 | #182 | Average 3.0% |
| Bulgarians | 39.7 /100 | #183 | Fair 3.0% |
| Immigrants | Ireland | 37.4 /100 | #184 | Fair 3.0% |
| Immigrants | Southern Europe | 35.3 /100 | #185 | Fair 3.0% |
| Immigrants | Mexico | 34.9 /100 | #186 | Fair 3.0% |
| Blacks/African Americans | 34.7 /100 | #187 | Fair 3.0% |
| Mexican American Indians | 34.7 /100 | #188 | Fair 3.0% |
| Africans | 32.9 /100 | #189 | Fair 3.0% |
Demographics Similar to Basques by Hearing Disability
In terms of hearing disability, the demographic groups most similar to Basques are Slovak (3.6%, a difference of 0.26%), French American Indian (3.6%, a difference of 0.33%), Nonimmigrants (3.6%, a difference of 0.39%), Scandinavian (3.6%, a difference of 0.39%), and Swedish (3.6%, a difference of 0.48%).
| Demographics | Rating | Rank | Hearing Disability |
| Czechs | 0.1 /100 | #271 | Tragic 3.5% |
| Fijians | 0.0 /100 | #272 | Tragic 3.5% |
| Puerto Ricans | 0.0 /100 | #273 | Tragic 3.5% |
| Swiss | 0.0 /100 | #274 | Tragic 3.5% |
| Czechoslovakians | 0.0 /100 | #275 | Tragic 3.6% |
| Danes | 0.0 /100 | #276 | Tragic 3.6% |
| Immigrants | Nonimmigrants | 0.0 /100 | #277 | Tragic 3.6% |
| Basques | 0.0 /100 | #278 | Tragic 3.6% |
| Slovaks | 0.0 /100 | #279 | Tragic 3.6% |
| French American Indians | 0.0 /100 | #280 | Tragic 3.6% |
| Scandinavians | 0.0 /100 | #281 | Tragic 3.6% |
| Swedes | 0.0 /100 | #282 | Tragic 3.6% |
| Blackfeet | 0.0 /100 | #283 | Tragic 3.6% |
| Immigrants | Micronesia | 0.0 /100 | #284 | Tragic 3.6% |
| Sioux | 0.0 /100 | #285 | Tragic 3.6% |