Immigrants from Indonesia vs Immigrants from Hungary Disability Age 35 to 64
COMPARE
Immigrants from Indonesia
Immigrants from Hungary
Disability Age 35 to 64
Disability Age 35 to 64 Comparison
Immigrants from Indonesia
Immigrants from Hungary
9.7%
DISABILITY AGE 35 TO 64
99.9/ 100
METRIC RATING
33rd/ 347
METRIC RANK
10.4%
DISABILITY AGE 35 TO 64
97.6/ 100
METRIC RATING
106th/ 347
METRIC RANK
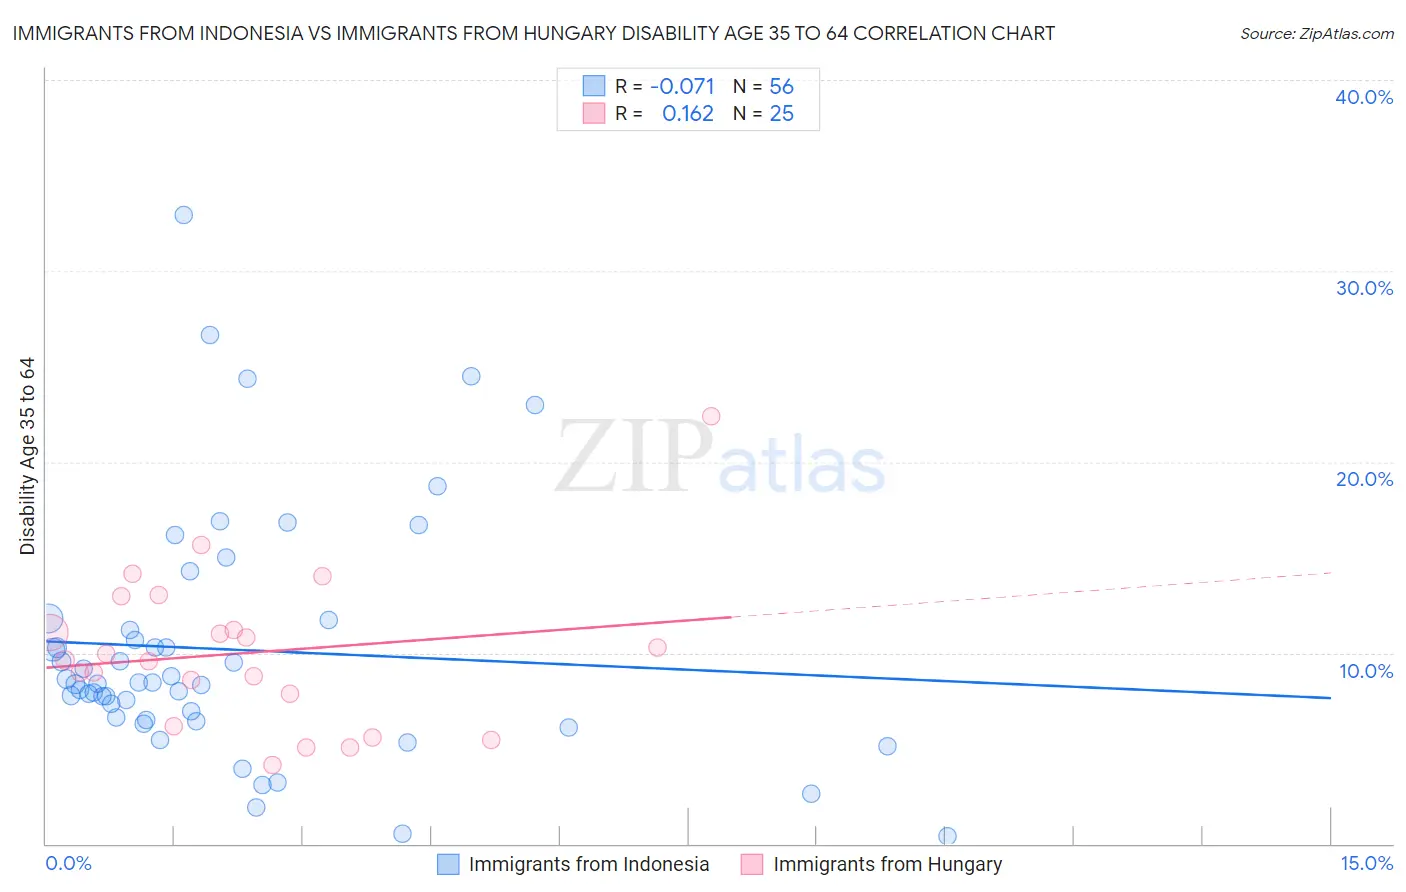
Immigrants from Indonesia vs Immigrants from Hungary Disability Age 35 to 64 Correlation Chart
The statistical analysis conducted on geographies consisting of 215,721,507 people shows a slight negative correlation between the proportion of Immigrants from Indonesia and percentage of population with a disability between the ages 34 and 64 in the United States with a correlation coefficient (R) of -0.071 and weighted average of 9.7%. Similarly, the statistical analysis conducted on geographies consisting of 195,643,662 people shows a poor positive correlation between the proportion of Immigrants from Hungary and percentage of population with a disability between the ages 34 and 64 in the United States with a correlation coefficient (R) of 0.162 and weighted average of 10.4%, a difference of 8.0%.
Disability Age 35 to 64 Correlation Summary
| Measurement | Immigrants from Indonesia | Immigrants from Hungary |
| Minimum | 0.38% | 4.1% |
| Maximum | 32.9% | 22.4% |
| Range | 32.6% | 18.3% |
| Mean | 10.2% | 10.0% |
| Median | 8.4% | 9.6% |
| Interquartile 25% (IQ1) | 6.6% | 7.0% |
| Interquartile 75% (IQ3) | 11.4% | 12.1% |
| Interquartile Range (IQR) | 4.9% | 5.1% |
| Standard Deviation (Sample) | 6.5% | 4.0% |
| Standard Deviation (Population) | 6.4% | 3.9% |
Similar Demographics by Disability Age 35 to 64
Demographics Similar to Immigrants from Indonesia by Disability Age 35 to 64
In terms of disability age 35 to 64, the demographic groups most similar to Immigrants from Indonesia are Turkish (9.7%, a difference of 0.070%), Immigrants from Australia (9.7%, a difference of 0.070%), Bulgarian (9.7%, a difference of 0.17%), Immigrants from Cuba (9.7%, a difference of 0.21%), and Immigrants from Turkey (9.7%, a difference of 0.29%).
| Demographics | Rating | Rank | Disability Age 35 to 64 |
| Immigrants | Sri Lanka | 100.0 /100 | #26 | Exceptional 9.5% |
| Immigrants | Asia | 100.0 /100 | #27 | Exceptional 9.5% |
| Immigrants | Pakistan | 100.0 /100 | #28 | Exceptional 9.5% |
| Immigrants | Ireland | 100.0 /100 | #29 | Exceptional 9.5% |
| Immigrants | Japan | 100.0 /100 | #30 | Exceptional 9.5% |
| Immigrants | Lithuania | 99.9 /100 | #31 | Exceptional 9.6% |
| Turks | 99.9 /100 | #32 | Exceptional 9.7% |
| Immigrants | Indonesia | 99.9 /100 | #33 | Exceptional 9.7% |
| Immigrants | Australia | 99.9 /100 | #34 | Exceptional 9.7% |
| Bulgarians | 99.9 /100 | #35 | Exceptional 9.7% |
| Immigrants | Cuba | 99.9 /100 | #36 | Exceptional 9.7% |
| Immigrants | Turkey | 99.9 /100 | #37 | Exceptional 9.7% |
| Egyptians | 99.9 /100 | #38 | Exceptional 9.7% |
| Immigrants | Belarus | 99.9 /100 | #39 | Exceptional 9.7% |
| Immigrants | Armenia | 99.9 /100 | #40 | Exceptional 9.7% |
Demographics Similar to Immigrants from Hungary by Disability Age 35 to 64
In terms of disability age 35 to 64, the demographic groups most similar to Immigrants from Hungary are Macedonian (10.4%, a difference of 0.15%), Immigrants from Austria (10.4%, a difference of 0.17%), Zimbabwean (10.4%, a difference of 0.19%), Ethiopian (10.5%, a difference of 0.21%), and Immigrants from Ukraine (10.4%, a difference of 0.31%).
| Demographics | Rating | Rank | Disability Age 35 to 64 |
| Palestinians | 98.2 /100 | #99 | Exceptional 10.4% |
| Immigrants | Jordan | 98.1 /100 | #100 | Exceptional 10.4% |
| Immigrants | Philippines | 98.0 /100 | #101 | Exceptional 10.4% |
| Immigrants | Western Asia | 98.0 /100 | #102 | Exceptional 10.4% |
| Immigrants | Ukraine | 97.9 /100 | #103 | Exceptional 10.4% |
| Immigrants | Austria | 97.8 /100 | #104 | Exceptional 10.4% |
| Macedonians | 97.8 /100 | #105 | Exceptional 10.4% |
| Immigrants | Hungary | 97.6 /100 | #106 | Exceptional 10.4% |
| Zimbabweans | 97.4 /100 | #107 | Exceptional 10.4% |
| Ethiopians | 97.4 /100 | #108 | Exceptional 10.5% |
| Immigrants | Ethiopia | 97.2 /100 | #109 | Exceptional 10.5% |
| Koreans | 97.1 /100 | #110 | Exceptional 10.5% |
| Brazilians | 96.9 /100 | #111 | Exceptional 10.5% |
| Assyrians/Chaldeans/Syriacs | 96.8 /100 | #112 | Exceptional 10.5% |
| Tongans | 96.6 /100 | #113 | Exceptional 10.5% |