Immigrants from Indonesia vs British Hearing Disability
COMPARE
Immigrants from Indonesia
British
Hearing Disability
Hearing Disability Comparison
Immigrants from Indonesia
British
2.8%
HEARING DISABILITY
94.7/ 100
METRIC RATING
103rd/ 347
METRIC RANK
3.5%
HEARING DISABILITY
0.1/ 100
METRIC RATING
265th/ 347
METRIC RANK
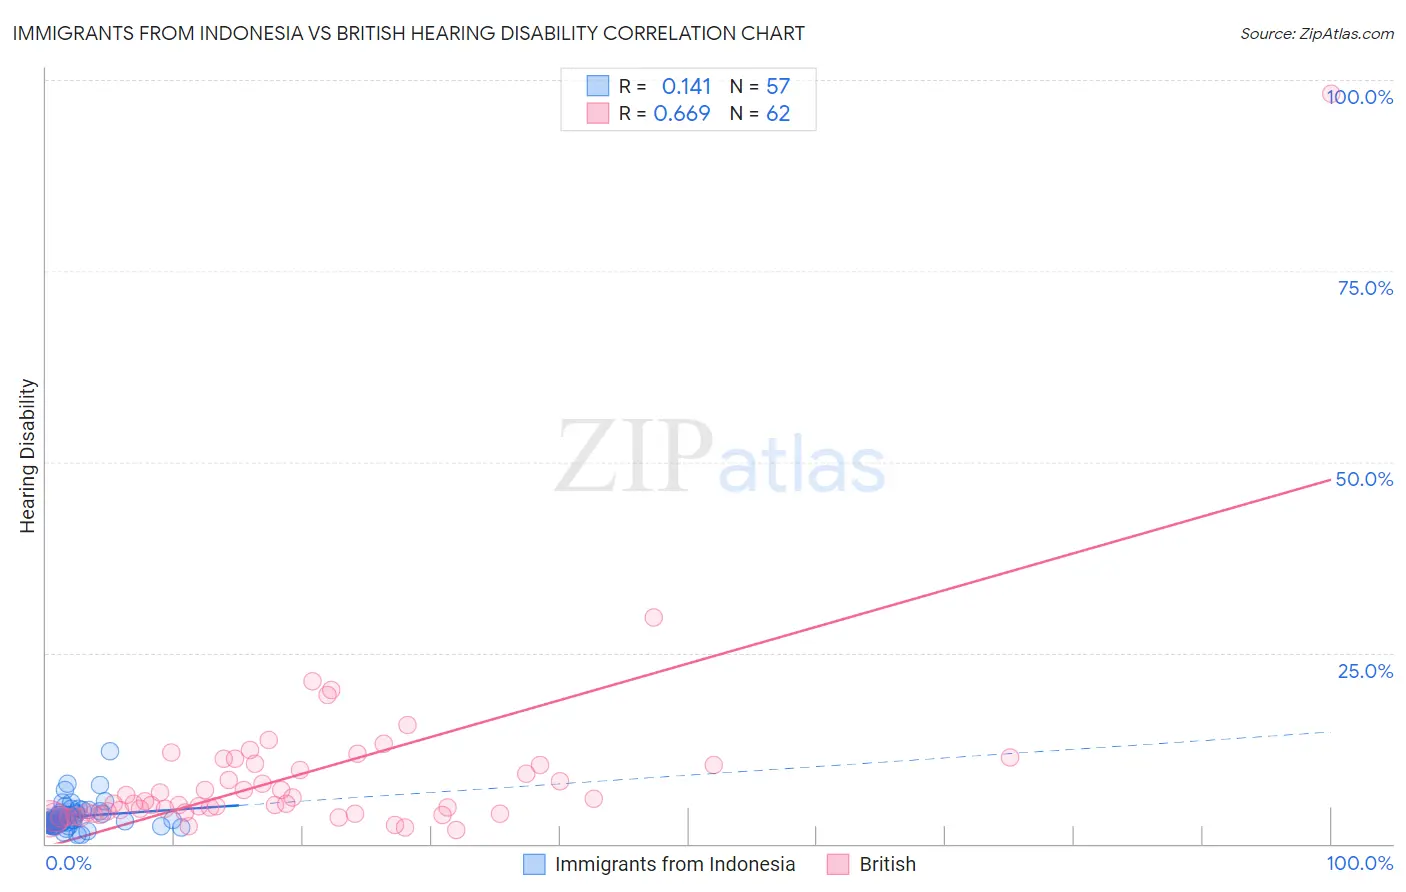
Immigrants from Indonesia vs British Hearing Disability Correlation Chart
The statistical analysis conducted on geographies consisting of 215,771,622 people shows a poor positive correlation between the proportion of Immigrants from Indonesia and percentage of population with hearing disability in the United States with a correlation coefficient (R) of 0.141 and weighted average of 2.8%. Similarly, the statistical analysis conducted on geographies consisting of 531,095,023 people shows a significant positive correlation between the proportion of British and percentage of population with hearing disability in the United States with a correlation coefficient (R) of 0.669 and weighted average of 3.5%, a difference of 24.4%.
Hearing Disability Correlation Summary
| Measurement | Immigrants from Indonesia | British |
| Minimum | 1.2% | 1.8% |
| Maximum | 12.2% | 98.2% |
| Range | 11.0% | 96.4% |
| Mean | 3.6% | 8.9% |
| Median | 3.1% | 5.3% |
| Interquartile 25% (IQ1) | 2.6% | 4.0% |
| Interquartile 75% (IQ3) | 4.1% | 10.4% |
| Interquartile Range (IQR) | 1.5% | 6.4% |
| Standard Deviation (Sample) | 1.8% | 12.7% |
| Standard Deviation (Population) | 1.8% | 12.6% |
Similar Demographics by Hearing Disability
Demographics Similar to Immigrants from Indonesia by Hearing Disability
In terms of hearing disability, the demographic groups most similar to Immigrants from Indonesia are Taiwanese (2.8%, a difference of 0.050%), Immigrants from Spain (2.8%, a difference of 0.060%), Immigrants from Eastern Africa (2.8%, a difference of 0.12%), Immigrants from Guatemala (2.8%, a difference of 0.17%), and Immigrants from Honduras (2.8%, a difference of 0.21%).
| Demographics | Rating | Rank | Hearing Disability |
| Immigrants | Somalia | 95.5 /100 | #96 | Exceptional 2.8% |
| Immigrants | Afghanistan | 95.3 /100 | #97 | Exceptional 2.8% |
| Immigrants | Honduras | 95.1 /100 | #98 | Exceptional 2.8% |
| Immigrants | Guatemala | 95.1 /100 | #99 | Exceptional 2.8% |
| Immigrants | Eastern Africa | 95.0 /100 | #100 | Exceptional 2.8% |
| Immigrants | Spain | 94.9 /100 | #101 | Exceptional 2.8% |
| Taiwanese | 94.8 /100 | #102 | Exceptional 2.8% |
| Immigrants | Indonesia | 94.7 /100 | #103 | Exceptional 2.8% |
| Burmese | 94.2 /100 | #104 | Exceptional 2.8% |
| Moroccans | 93.9 /100 | #105 | Exceptional 2.8% |
| Hondurans | 93.4 /100 | #106 | Exceptional 2.8% |
| Immigrants | Chile | 93.4 /100 | #107 | Exceptional 2.8% |
| Guatemalans | 93.2 /100 | #108 | Exceptional 2.8% |
| Turks | 93.0 /100 | #109 | Exceptional 2.8% |
| Cypriots | 92.9 /100 | #110 | Exceptional 2.8% |
Demographics Similar to British by Hearing Disability
In terms of hearing disability, the demographic groups most similar to British are Immigrants from Germany (3.5%, a difference of 0.020%), Belgian (3.5%, a difference of 0.18%), Immigrants from Canada (3.5%, a difference of 0.24%), Immigrants from North America (3.5%, a difference of 0.28%), and Hawaiian (3.5%, a difference of 0.39%).
| Demographics | Rating | Rank | Hearing Disability |
| Northern Europeans | 0.2 /100 | #258 | Tragic 3.4% |
| Slovenes | 0.1 /100 | #259 | Tragic 3.5% |
| Portuguese | 0.1 /100 | #260 | Tragic 3.5% |
| Hawaiians | 0.1 /100 | #261 | Tragic 3.5% |
| Immigrants | North America | 0.1 /100 | #262 | Tragic 3.5% |
| Immigrants | Canada | 0.1 /100 | #263 | Tragic 3.5% |
| Immigrants | Germany | 0.1 /100 | #264 | Tragic 3.5% |
| British | 0.1 /100 | #265 | Tragic 3.5% |
| Belgians | 0.1 /100 | #266 | Tragic 3.5% |
| Canadians | 0.1 /100 | #267 | Tragic 3.5% |
| Spaniards | 0.1 /100 | #268 | Tragic 3.5% |
| Ute | 0.1 /100 | #269 | Tragic 3.5% |
| Europeans | 0.1 /100 | #270 | Tragic 3.5% |
| Czechs | 0.1 /100 | #271 | Tragic 3.5% |
| Fijians | 0.0 /100 | #272 | Tragic 3.5% |