Immigrants from Uruguay vs Czechoslovakian Female Disability
COMPARE
Immigrants from Uruguay
Czechoslovakian
Female Disability
Female Disability Comparison
Immigrants from Uruguay
Czechoslovakians
11.7%
FEMALE DISABILITY
98.5/ 100
METRIC RATING
100th/ 347
METRIC RANK
12.7%
FEMALE DISABILITY
0.9/ 100
METRIC RATING
262nd/ 347
METRIC RANK
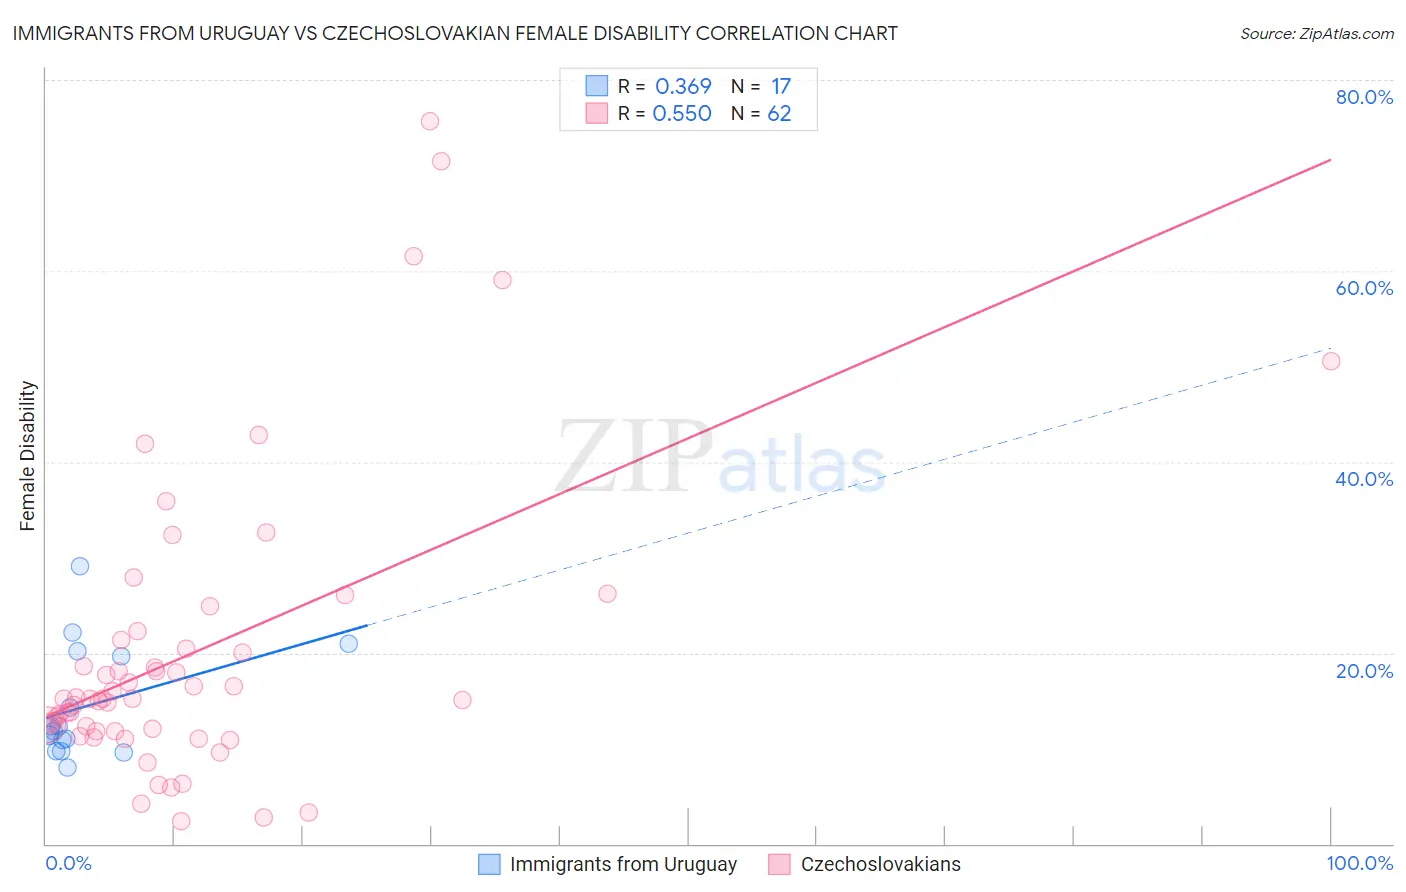
Immigrants from Uruguay vs Czechoslovakian Female Disability Correlation Chart
The statistical analysis conducted on geographies consisting of 133,256,548 people shows a mild positive correlation between the proportion of Immigrants from Uruguay and percentage of females with a disability in the United States with a correlation coefficient (R) of 0.369 and weighted average of 11.7%. Similarly, the statistical analysis conducted on geographies consisting of 368,648,423 people shows a substantial positive correlation between the proportion of Czechoslovakians and percentage of females with a disability in the United States with a correlation coefficient (R) of 0.550 and weighted average of 12.7%, a difference of 8.7%.
Female Disability Correlation Summary
| Measurement | Immigrants from Uruguay | Czechoslovakian |
| Minimum | 8.0% | 2.3% |
| Maximum | 29.1% | 75.7% |
| Range | 21.1% | 73.3% |
| Mean | 14.4% | 20.1% |
| Median | 11.9% | 15.2% |
| Interquartile 25% (IQ1) | 10.3% | 11.8% |
| Interquartile 75% (IQ3) | 19.9% | 21.4% |
| Interquartile Range (IQR) | 9.6% | 9.5% |
| Standard Deviation (Sample) | 5.8% | 15.6% |
| Standard Deviation (Population) | 5.6% | 15.5% |
Similar Demographics by Female Disability
Demographics Similar to Immigrants from Uruguay by Female Disability
In terms of female disability, the demographic groups most similar to Immigrants from Uruguay are Immigrants from Costa Rica (11.7%, a difference of 0.020%), Immigrants from South Eastern Asia (11.7%, a difference of 0.030%), Immigrants from Philippines (11.7%, a difference of 0.050%), Immigrants from Eastern Africa (11.7%, a difference of 0.10%), and Immigrants from Western Asia (11.7%, a difference of 0.11%).
| Demographics | Rating | Rank | Female Disability |
| Immigrants | Sierra Leone | 99.4 /100 | #93 | Exceptional 11.6% |
| Immigrants | Brazil | 99.4 /100 | #94 | Exceptional 11.6% |
| Immigrants | Northern Europe | 99.4 /100 | #95 | Exceptional 11.6% |
| Immigrants | Russia | 99.0 /100 | #96 | Exceptional 11.7% |
| Koreans | 99.0 /100 | #97 | Exceptional 11.7% |
| Uruguayans | 98.8 /100 | #98 | Exceptional 11.7% |
| Immigrants | Philippines | 98.6 /100 | #99 | Exceptional 11.7% |
| Immigrants | Uruguay | 98.5 /100 | #100 | Exceptional 11.7% |
| Immigrants | Costa Rica | 98.4 /100 | #101 | Exceptional 11.7% |
| Immigrants | South Eastern Asia | 98.4 /100 | #102 | Exceptional 11.7% |
| Immigrants | Eastern Africa | 98.3 /100 | #103 | Exceptional 11.7% |
| Immigrants | Western Asia | 98.3 /100 | #104 | Exceptional 11.7% |
| Australians | 98.3 /100 | #105 | Exceptional 11.7% |
| Immigrants | Greece | 98.2 /100 | #106 | Exceptional 11.7% |
| Latvians | 98.2 /100 | #107 | Exceptional 11.7% |
Demographics Similar to Czechoslovakians by Female Disability
In terms of female disability, the demographic groups most similar to Czechoslovakians are Bermudan (12.7%, a difference of 0.070%), Subsaharan African (12.7%, a difference of 0.11%), Immigrants from Armenia (12.7%, a difference of 0.12%), Liberian (12.7%, a difference of 0.20%), and Aleut (12.7%, a difference of 0.20%).
| Demographics | Rating | Rank | Female Disability |
| Immigrants | Germany | 1.3 /100 | #255 | Tragic 12.7% |
| British West Indians | 1.2 /100 | #256 | Tragic 12.7% |
| Liberians | 1.1 /100 | #257 | Tragic 12.7% |
| Aleuts | 1.1 /100 | #258 | Tragic 12.7% |
| Immigrants | Armenia | 1.0 /100 | #259 | Tragic 12.7% |
| Sub-Saharan Africans | 1.0 /100 | #260 | Tragic 12.7% |
| Bermudans | 1.0 /100 | #261 | Tragic 12.7% |
| Czechoslovakians | 0.9 /100 | #262 | Tragic 12.7% |
| Spaniards | 0.7 /100 | #263 | Tragic 12.8% |
| Alaska Natives | 0.6 /100 | #264 | Tragic 12.8% |
| West Indians | 0.5 /100 | #265 | Tragic 12.8% |
| Finns | 0.4 /100 | #266 | Tragic 12.8% |
| Senegalese | 0.4 /100 | #267 | Tragic 12.8% |
| Immigrants | Laos | 0.4 /100 | #268 | Tragic 12.8% |
| Indonesians | 0.4 /100 | #269 | Tragic 12.8% |