Immigrants from Guatemala vs Immigrants from Moldova Disability Age Over 75
COMPARE
Immigrants from Guatemala
Immigrants from Moldova
Disability Age Over 75
Disability Age Over 75 Comparison
Immigrants from Guatemala
Immigrants from Moldova
49.1%
DISABILITY AGE OVER 75
0.1/ 100
METRIC RATING
274th/ 347
METRIC RANK
47.4%
DISABILITY AGE OVER 75
39.9/ 100
METRIC RATING
182nd/ 347
METRIC RANK
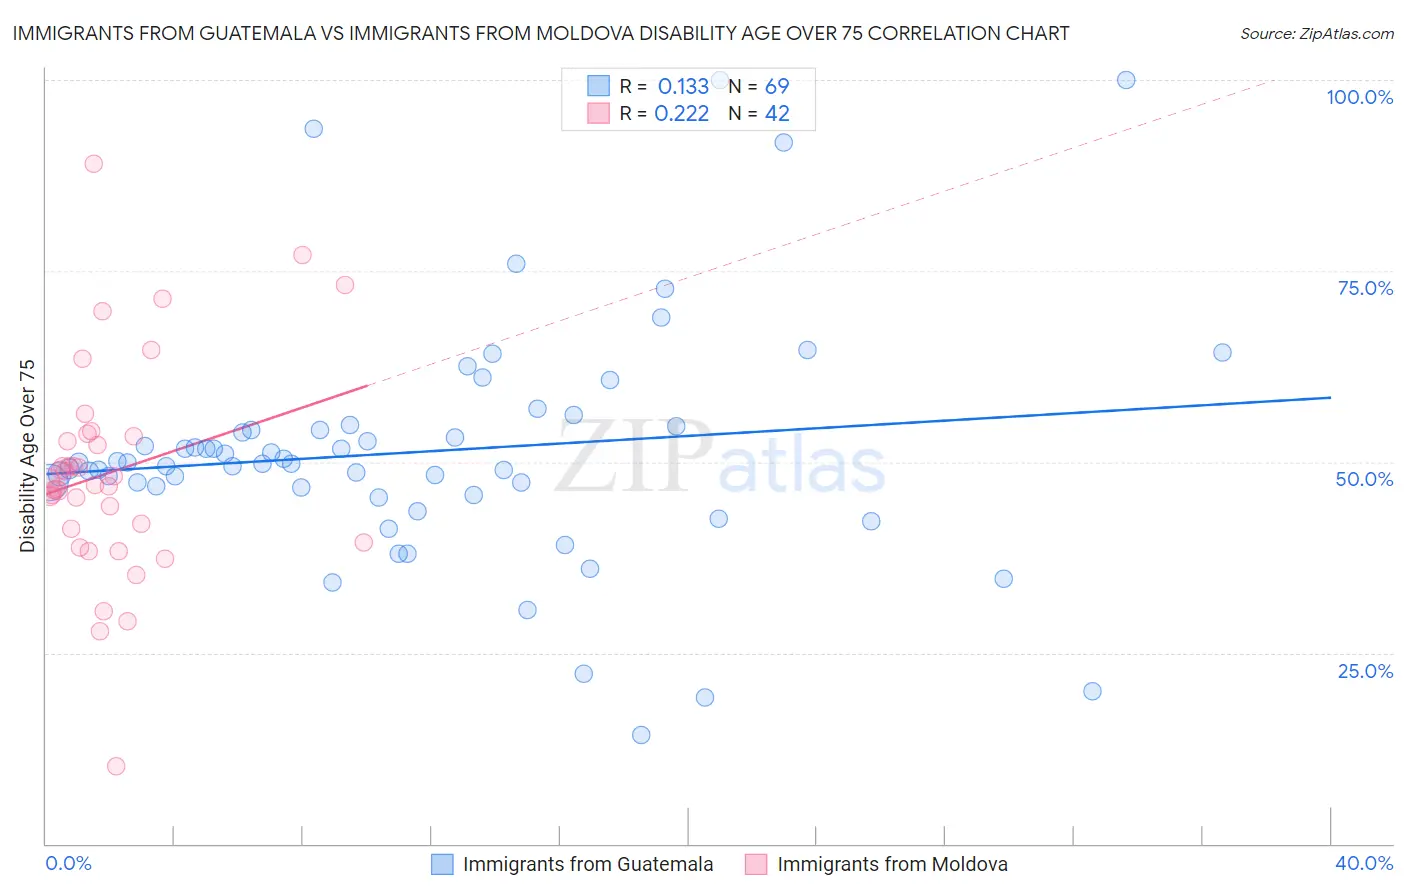
Immigrants from Guatemala vs Immigrants from Moldova Disability Age Over 75 Correlation Chart
The statistical analysis conducted on geographies consisting of 376,935,888 people shows a poor positive correlation between the proportion of Immigrants from Guatemala and percentage of population with a disability over the age of 75 in the United States with a correlation coefficient (R) of 0.133 and weighted average of 49.1%. Similarly, the statistical analysis conducted on geographies consisting of 124,351,560 people shows a weak positive correlation between the proportion of Immigrants from Moldova and percentage of population with a disability over the age of 75 in the United States with a correlation coefficient (R) of 0.222 and weighted average of 47.4%, a difference of 3.5%.
Disability Age Over 75 Correlation Summary
| Measurement | Immigrants from Guatemala | Immigrants from Moldova |
| Minimum | 14.3% | 10.1% |
| Maximum | 100.0% | 89.0% |
| Range | 85.7% | 78.9% |
| Mean | 51.3% | 48.6% |
| Median | 49.8% | 47.2% |
| Interquartile 25% (IQ1) | 46.1% | 41.3% |
| Interquartile 75% (IQ3) | 54.4% | 53.4% |
| Interquartile Range (IQR) | 8.3% | 12.1% |
| Standard Deviation (Sample) | 15.8% | 14.1% |
| Standard Deviation (Population) | 15.7% | 13.9% |
Similar Demographics by Disability Age Over 75
Demographics Similar to Immigrants from Guatemala by Disability Age Over 75
In terms of disability age over 75, the demographic groups most similar to Immigrants from Guatemala are Immigrants from Dominica (49.1%, a difference of 0.010%), Immigrants from Iraq (49.1%, a difference of 0.070%), Assyrian/Chaldean/Syriac (49.1%, a difference of 0.13%), Immigrants from Uzbekistan (49.2%, a difference of 0.13%), and Fijian (49.0%, a difference of 0.14%).
| Demographics | Rating | Rank | Disability Age Over 75 |
| Malaysians | 0.2 /100 | #267 | Tragic 49.0% |
| Guatemalans | 0.2 /100 | #268 | Tragic 49.0% |
| Immigrants | El Salvador | 0.2 /100 | #269 | Tragic 49.0% |
| Potawatomi | 0.2 /100 | #270 | Tragic 49.0% |
| Fijians | 0.2 /100 | #271 | Tragic 49.0% |
| Assyrians/Chaldeans/Syriacs | 0.2 /100 | #272 | Tragic 49.1% |
| Immigrants | Iraq | 0.1 /100 | #273 | Tragic 49.1% |
| Immigrants | Guatemala | 0.1 /100 | #274 | Tragic 49.1% |
| Immigrants | Dominica | 0.1 /100 | #275 | Tragic 49.1% |
| Immigrants | Uzbekistan | 0.1 /100 | #276 | Tragic 49.2% |
| Hawaiians | 0.1 /100 | #277 | Tragic 49.2% |
| Immigrants | Laos | 0.1 /100 | #278 | Tragic 49.2% |
| Guamanians/Chamorros | 0.0 /100 | #279 | Tragic 49.4% |
| Bangladeshis | 0.0 /100 | #280 | Tragic 49.4% |
| Belizeans | 0.0 /100 | #281 | Tragic 49.4% |
Demographics Similar to Immigrants from Moldova by Disability Age Over 75
In terms of disability age over 75, the demographic groups most similar to Immigrants from Moldova are Immigrants from Kazakhstan (47.4%, a difference of 0.010%), Delaware (47.5%, a difference of 0.020%), Sierra Leonean (47.4%, a difference of 0.040%), Immigrants from Ecuador (47.4%, a difference of 0.040%), and Cuban (47.4%, a difference of 0.050%).
| Demographics | Rating | Rank | Disability Age Over 75 |
| Immigrants | Haiti | 49.7 /100 | #175 | Average 47.3% |
| Ecuadorians | 46.7 /100 | #176 | Average 47.4% |
| Haitians | 44.6 /100 | #177 | Average 47.4% |
| Cubans | 42.1 /100 | #178 | Average 47.4% |
| Sierra Leoneans | 41.7 /100 | #179 | Average 47.4% |
| Immigrants | Ecuador | 41.7 /100 | #180 | Average 47.4% |
| Immigrants | Kazakhstan | 40.4 /100 | #181 | Average 47.4% |
| Immigrants | Moldova | 39.9 /100 | #182 | Fair 47.4% |
| Delaware | 39.1 /100 | #183 | Fair 47.5% |
| Immigrants | Nigeria | 34.0 /100 | #184 | Fair 47.5% |
| Ghanaians | 33.0 /100 | #185 | Fair 47.5% |
| Sudanese | 32.0 /100 | #186 | Fair 47.5% |
| Immigrants | Sudan | 31.8 /100 | #187 | Fair 47.5% |
| Basques | 30.9 /100 | #188 | Fair 47.6% |
| Immigrants | Kenya | 30.8 /100 | #189 | Fair 47.6% |