Guyanese vs Immigrants from Moldova Disability Age Over 75
COMPARE
Guyanese
Immigrants from Moldova
Disability Age Over 75
Disability Age Over 75 Comparison
Guyanese
Immigrants from Moldova
46.9%
DISABILITY AGE OVER 75
84.3/ 100
METRIC RATING
146th/ 347
METRIC RANK
47.4%
DISABILITY AGE OVER 75
39.9/ 100
METRIC RATING
182nd/ 347
METRIC RANK
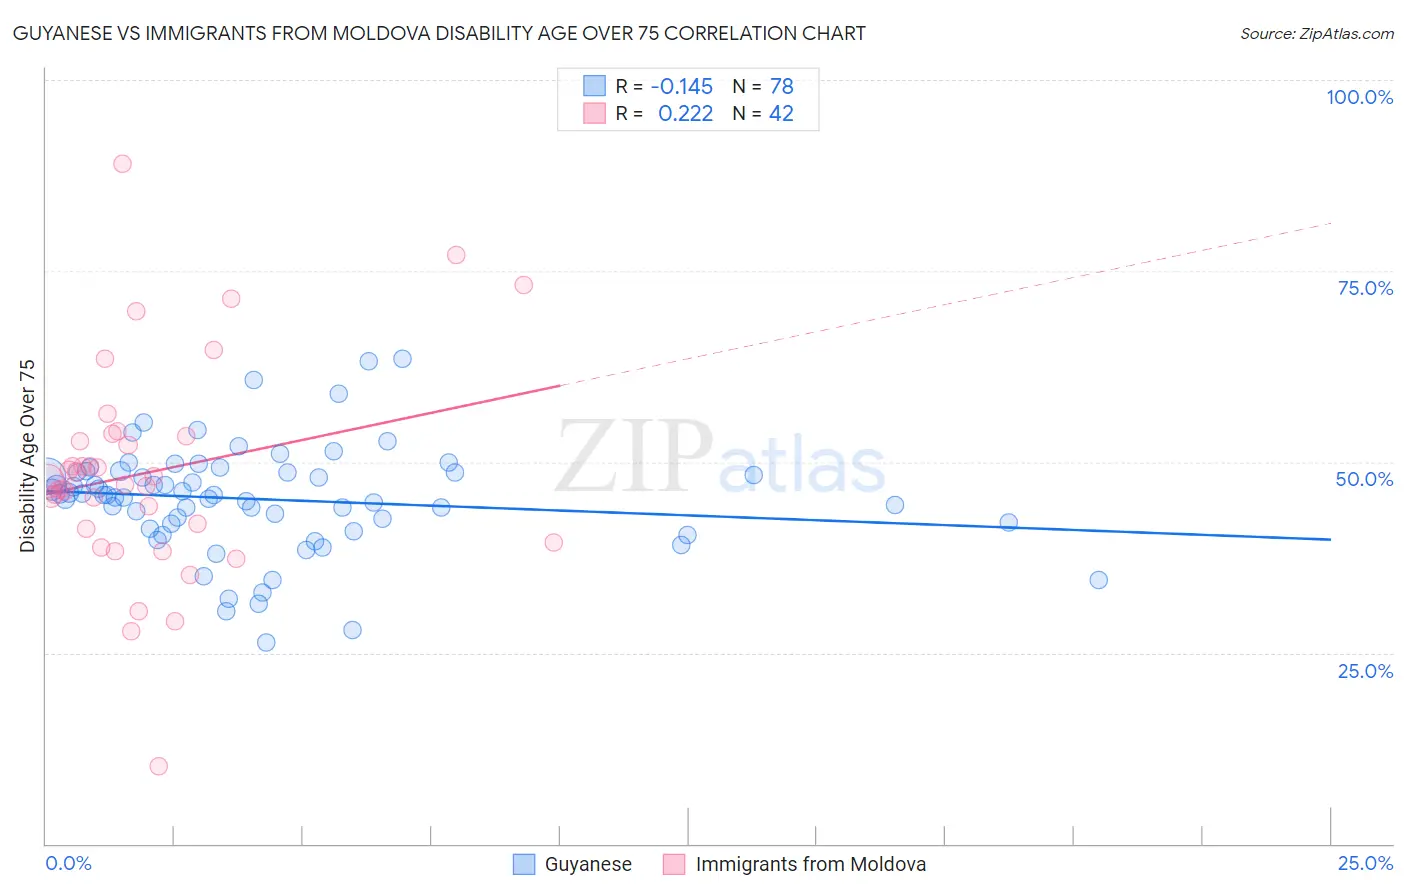
Guyanese vs Immigrants from Moldova Disability Age Over 75 Correlation Chart
The statistical analysis conducted on geographies consisting of 176,616,410 people shows a poor negative correlation between the proportion of Guyanese and percentage of population with a disability over the age of 75 in the United States with a correlation coefficient (R) of -0.145 and weighted average of 46.9%. Similarly, the statistical analysis conducted on geographies consisting of 124,351,560 people shows a weak positive correlation between the proportion of Immigrants from Moldova and percentage of population with a disability over the age of 75 in the United States with a correlation coefficient (R) of 0.222 and weighted average of 47.4%, a difference of 1.2%.
Disability Age Over 75 Correlation Summary
| Measurement | Guyanese | Immigrants from Moldova |
| Minimum | 26.4% | 10.1% |
| Maximum | 63.4% | 89.0% |
| Range | 37.1% | 78.9% |
| Mean | 45.1% | 48.6% |
| Median | 45.7% | 47.2% |
| Interquartile 25% (IQ1) | 41.8% | 41.3% |
| Interquartile 75% (IQ3) | 48.6% | 53.4% |
| Interquartile Range (IQR) | 6.8% | 12.1% |
| Standard Deviation (Sample) | 7.1% | 14.1% |
| Standard Deviation (Population) | 7.0% | 13.9% |
Similar Demographics by Disability Age Over 75
Demographics Similar to Guyanese by Disability Age Over 75
In terms of disability age over 75, the demographic groups most similar to Guyanese are Costa Rican (46.9%, a difference of 0.010%), Immigrants from Peru (46.9%, a difference of 0.010%), Venezuelan (46.9%, a difference of 0.030%), Bermudan (46.9%, a difference of 0.060%), and Peruvian (46.8%, a difference of 0.10%).
| Demographics | Rating | Rank | Disability Age Over 75 |
| Yugoslavians | 88.5 /100 | #139 | Excellent 46.8% |
| Immigrants | Costa Rica | 87.4 /100 | #140 | Excellent 46.8% |
| Lebanese | 87.0 /100 | #141 | Excellent 46.8% |
| Peruvians | 86.5 /100 | #142 | Excellent 46.8% |
| Bermudans | 85.6 /100 | #143 | Excellent 46.9% |
| Venezuelans | 85.0 /100 | #144 | Excellent 46.9% |
| Costa Ricans | 84.5 /100 | #145 | Excellent 46.9% |
| Guyanese | 84.3 /100 | #146 | Excellent 46.9% |
| Immigrants | Peru | 84.1 /100 | #147 | Excellent 46.9% |
| Asians | 81.6 /100 | #148 | Excellent 46.9% |
| Welsh | 81.3 /100 | #149 | Excellent 47.0% |
| Immigrants | Russia | 79.3 /100 | #150 | Good 47.0% |
| French Canadians | 79.0 /100 | #151 | Good 47.0% |
| Immigrants | Asia | 76.5 /100 | #152 | Good 47.0% |
| Immigrants | Zaire | 74.8 /100 | #153 | Good 47.1% |
Demographics Similar to Immigrants from Moldova by Disability Age Over 75
In terms of disability age over 75, the demographic groups most similar to Immigrants from Moldova are Immigrants from Kazakhstan (47.4%, a difference of 0.010%), Delaware (47.5%, a difference of 0.020%), Sierra Leonean (47.4%, a difference of 0.040%), Immigrants from Ecuador (47.4%, a difference of 0.040%), and Cuban (47.4%, a difference of 0.050%).
| Demographics | Rating | Rank | Disability Age Over 75 |
| Immigrants | Haiti | 49.7 /100 | #175 | Average 47.3% |
| Ecuadorians | 46.7 /100 | #176 | Average 47.4% |
| Haitians | 44.6 /100 | #177 | Average 47.4% |
| Cubans | 42.1 /100 | #178 | Average 47.4% |
| Sierra Leoneans | 41.7 /100 | #179 | Average 47.4% |
| Immigrants | Ecuador | 41.7 /100 | #180 | Average 47.4% |
| Immigrants | Kazakhstan | 40.4 /100 | #181 | Average 47.4% |
| Immigrants | Moldova | 39.9 /100 | #182 | Fair 47.4% |
| Delaware | 39.1 /100 | #183 | Fair 47.5% |
| Immigrants | Nigeria | 34.0 /100 | #184 | Fair 47.5% |
| Ghanaians | 33.0 /100 | #185 | Fair 47.5% |
| Sudanese | 32.0 /100 | #186 | Fair 47.5% |
| Immigrants | Sudan | 31.8 /100 | #187 | Fair 47.5% |
| Basques | 30.9 /100 | #188 | Fair 47.6% |
| Immigrants | Kenya | 30.8 /100 | #189 | Fair 47.6% |