Immigrants from Grenada vs Tongan Cognitive Disability
COMPARE
Immigrants from Grenada
Tongan
Cognitive Disability
Cognitive Disability Comparison
Immigrants from Grenada
Tongans
17.9%
COGNITIVE DISABILITY
0.6/ 100
METRIC RATING
252nd/ 347
METRIC RANK
17.8%
COGNITIVE DISABILITY
2.1/ 100
METRIC RATING
232nd/ 347
METRIC RANK
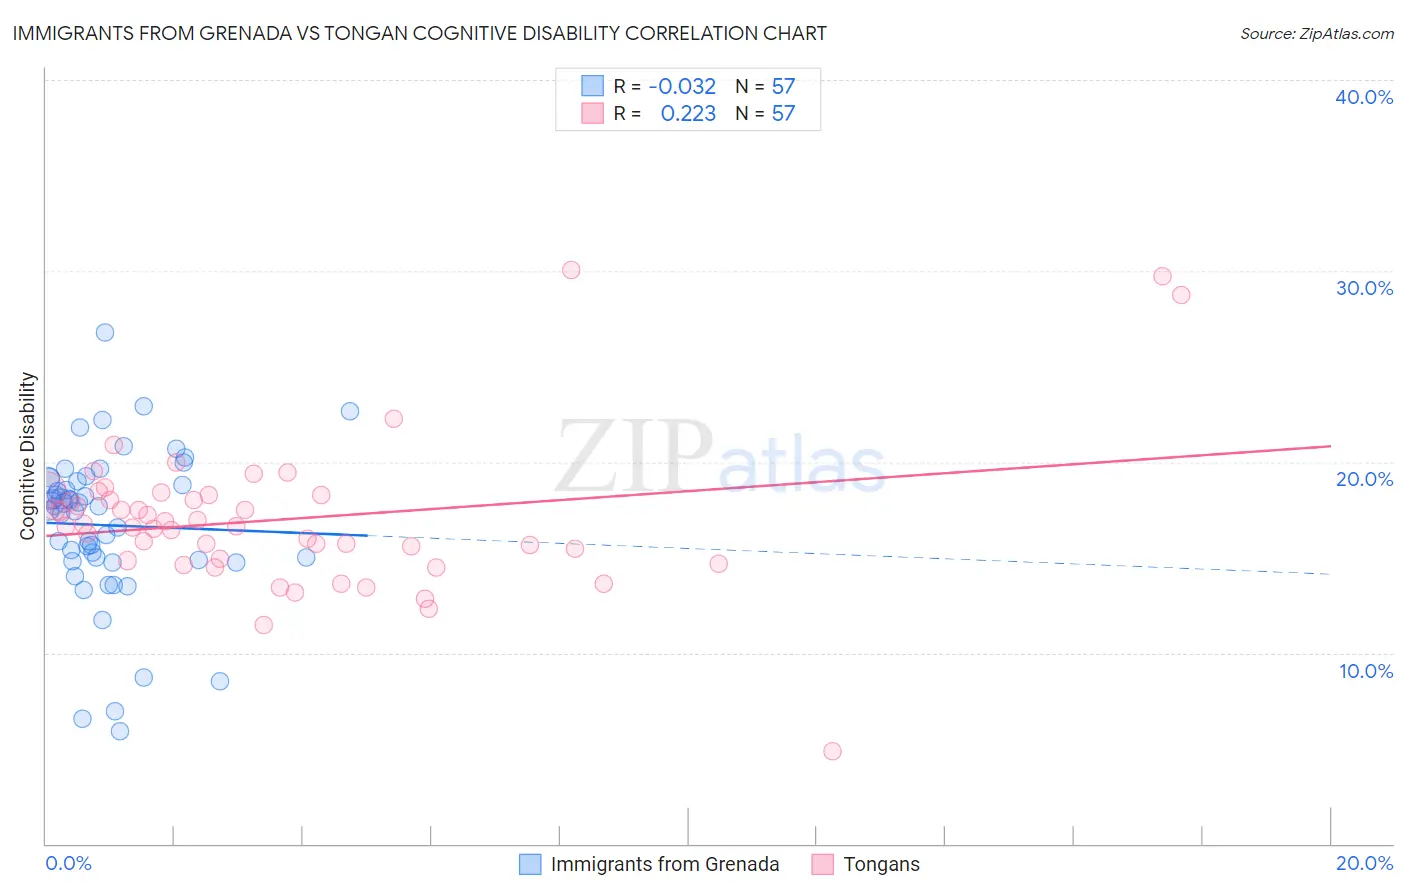
Immigrants from Grenada vs Tongan Cognitive Disability Correlation Chart
The statistical analysis conducted on geographies consisting of 67,189,782 people shows no correlation between the proportion of Immigrants from Grenada and percentage of population with cognitive disability in the United States with a correlation coefficient (R) of -0.032 and weighted average of 17.9%. Similarly, the statistical analysis conducted on geographies consisting of 102,895,026 people shows a weak positive correlation between the proportion of Tongans and percentage of population with cognitive disability in the United States with a correlation coefficient (R) of 0.223 and weighted average of 17.8%, a difference of 0.83%.
Cognitive Disability Correlation Summary
| Measurement | Immigrants from Grenada | Tongan |
| Minimum | 5.9% | 4.8% |
| Maximum | 26.8% | 30.0% |
| Range | 20.9% | 25.2% |
| Mean | 16.7% | 17.0% |
| Median | 17.7% | 16.6% |
| Interquartile 25% (IQ1) | 14.8% | 14.9% |
| Interquartile 75% (IQ3) | 19.0% | 18.3% |
| Interquartile Range (IQR) | 4.2% | 3.4% |
| Standard Deviation (Sample) | 4.0% | 4.0% |
| Standard Deviation (Population) | 4.0% | 3.9% |
Demographics Similar to Immigrants from Grenada and Tongans by Cognitive Disability
In terms of cognitive disability, the demographic groups most similar to Immigrants from Grenada are Malaysian (17.9%, a difference of 0.010%), Cree (17.9%, a difference of 0.020%), Immigrants from Ethiopia (17.9%, a difference of 0.020%), French American Indian (17.9%, a difference of 0.070%), and Samoan (17.9%, a difference of 0.080%). Similarly, the demographic groups most similar to Tongans are Panamanian (17.8%, a difference of 0.0%), Osage (17.8%, a difference of 0.020%), Spanish American Indian (17.8%, a difference of 0.020%), Immigrants from Iraq (17.8%, a difference of 0.080%), and Immigrants from Mexico (17.8%, a difference of 0.090%).
| Demographics | Rating | Rank | Cognitive Disability |
| Tongans | 2.1 /100 | #232 | Tragic 17.8% |
| Panamanians | 2.1 /100 | #233 | Tragic 17.8% |
| Osage | 2.0 /100 | #234 | Tragic 17.8% |
| Spanish American Indians | 2.0 /100 | #235 | Tragic 17.8% |
| Immigrants | Iraq | 1.8 /100 | #236 | Tragic 17.8% |
| Immigrants | Mexico | 1.8 /100 | #237 | Tragic 17.8% |
| Cheyenne | 1.7 /100 | #238 | Tragic 17.8% |
| Cajuns | 1.4 /100 | #239 | Tragic 17.8% |
| Iraqis | 1.4 /100 | #240 | Tragic 17.8% |
| Mexicans | 1.1 /100 | #241 | Tragic 17.8% |
| Paiute | 1.1 /100 | #242 | Tragic 17.8% |
| Immigrants | Bangladesh | 1.0 /100 | #243 | Tragic 17.8% |
| Jamaicans | 0.9 /100 | #244 | Tragic 17.9% |
| Trinidadians and Tobagonians | 0.8 /100 | #245 | Tragic 17.9% |
| Immigrants | Thailand | 0.8 /100 | #246 | Tragic 17.9% |
| Samoans | 0.7 /100 | #247 | Tragic 17.9% |
| French American Indians | 0.7 /100 | #248 | Tragic 17.9% |
| Cree | 0.7 /100 | #249 | Tragic 17.9% |
| Immigrants | Ethiopia | 0.7 /100 | #250 | Tragic 17.9% |
| Malaysians | 0.6 /100 | #251 | Tragic 17.9% |
| Immigrants | Grenada | 0.6 /100 | #252 | Tragic 17.9% |