Immigrants from Greece vs Mexican 4th Grade
COMPARE
Immigrants from Greece
Mexican
4th Grade
4th Grade Comparison
Immigrants from Greece
Mexicans
97.7%
4TH GRADE
83.8/ 100
METRIC RATING
141st/ 347
METRIC RANK
95.6%
4TH GRADE
0.0/ 100
METRIC RATING
336th/ 347
METRIC RANK
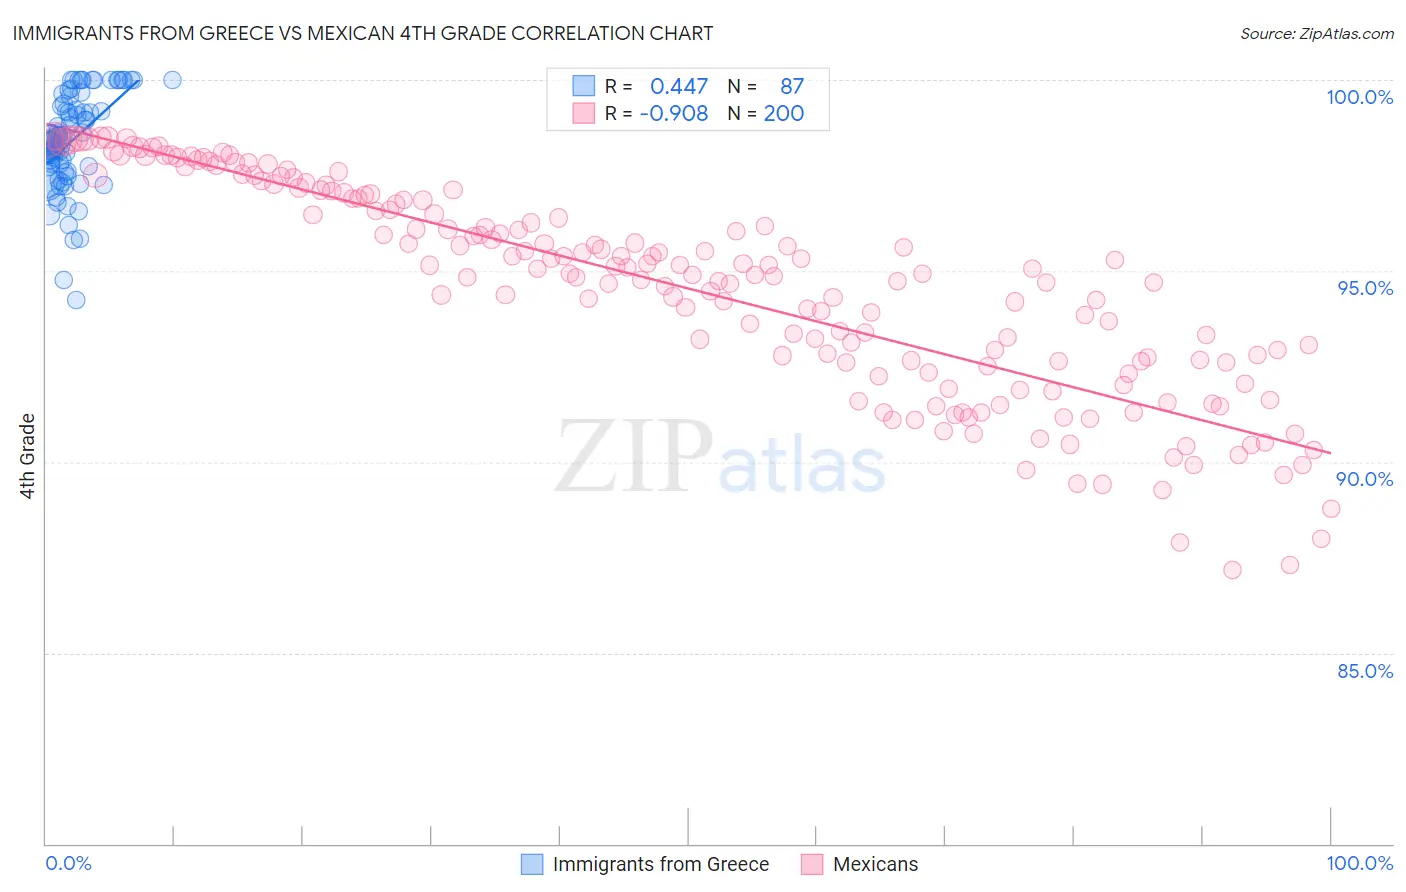
Immigrants from Greece vs Mexican 4th Grade Correlation Chart
The statistical analysis conducted on geographies consisting of 216,879,847 people shows a moderate positive correlation between the proportion of Immigrants from Greece and percentage of population with at least 4th grade education in the United States with a correlation coefficient (R) of 0.447 and weighted average of 97.7%. Similarly, the statistical analysis conducted on geographies consisting of 565,340,380 people shows a near-perfect negative correlation between the proportion of Mexicans and percentage of population with at least 4th grade education in the United States with a correlation coefficient (R) of -0.908 and weighted average of 95.6%, a difference of 2.2%.
4th Grade Correlation Summary
| Measurement | Immigrants from Greece | Mexican |
| Minimum | 94.3% | 87.2% |
| Maximum | 100.0% | 98.5% |
| Range | 5.7% | 11.4% |
| Mean | 98.4% | 94.5% |
| Median | 98.5% | 94.9% |
| Interquartile 25% (IQ1) | 97.8% | 92.6% |
| Interquartile 75% (IQ3) | 99.3% | 96.9% |
| Interquartile Range (IQR) | 1.6% | 4.3% |
| Standard Deviation (Sample) | 1.2% | 2.7% |
| Standard Deviation (Population) | 1.2% | 2.7% |
Similar Demographics by 4th Grade
Demographics Similar to Immigrants from Greece by 4th Grade
In terms of 4th grade, the demographic groups most similar to Immigrants from Greece are Filipino (97.7%, a difference of 0.0%), Immigrants from North Macedonia (97.7%, a difference of 0.0%), Seminole (97.7%, a difference of 0.010%), Burmese (97.7%, a difference of 0.010%), and Spaniard (97.7%, a difference of 0.010%).
| Demographics | Rating | Rank | 4th Grade |
| Palestinians | 88.1 /100 | #134 | Excellent 97.7% |
| Cambodians | 87.8 /100 | #135 | Excellent 97.7% |
| Israelis | 86.2 /100 | #136 | Excellent 97.7% |
| Immigrants | Turkey | 86.0 /100 | #137 | Excellent 97.7% |
| Blackfeet | 86.0 /100 | #138 | Excellent 97.7% |
| Seminole | 84.7 /100 | #139 | Excellent 97.7% |
| Filipinos | 84.0 /100 | #140 | Excellent 97.7% |
| Immigrants | Greece | 83.8 /100 | #141 | Excellent 97.7% |
| Immigrants | North Macedonia | 83.3 /100 | #142 | Excellent 97.7% |
| Burmese | 82.8 /100 | #143 | Excellent 97.7% |
| Spaniards | 82.7 /100 | #144 | Excellent 97.7% |
| Immigrants | Moldova | 82.4 /100 | #145 | Excellent 97.7% |
| Jordanians | 81.3 /100 | #146 | Excellent 97.7% |
| Ute | 80.6 /100 | #147 | Excellent 97.7% |
| Hopi | 80.6 /100 | #148 | Excellent 97.7% |
Demographics Similar to Mexicans by 4th Grade
In terms of 4th grade, the demographic groups most similar to Mexicans are Immigrants from Latin America (95.7%, a difference of 0.070%), Immigrants from Dominican Republic (95.7%, a difference of 0.13%), Immigrants from Cabo Verde (95.7%, a difference of 0.13%), Central American (95.5%, a difference of 0.13%), and Nepalese (95.5%, a difference of 0.13%).
| Demographics | Rating | Rank | 4th Grade |
| Immigrants | Cambodia | 0.0 /100 | #329 | Tragic 95.8% |
| Immigrants | Fiji | 0.0 /100 | #330 | Tragic 95.8% |
| Immigrants | Armenia | 0.0 /100 | #331 | Tragic 95.8% |
| Immigrants | Honduras | 0.0 /100 | #332 | Tragic 95.8% |
| Immigrants | Dominican Republic | 0.0 /100 | #333 | Tragic 95.7% |
| Immigrants | Cabo Verde | 0.0 /100 | #334 | Tragic 95.7% |
| Immigrants | Latin America | 0.0 /100 | #335 | Tragic 95.7% |
| Mexicans | 0.0 /100 | #336 | Tragic 95.6% |
| Central Americans | 0.0 /100 | #337 | Tragic 95.5% |
| Nepalese | 0.0 /100 | #338 | Tragic 95.5% |
| Guatemalans | 0.0 /100 | #339 | Tragic 95.3% |
| Yakama | 0.0 /100 | #340 | Tragic 95.2% |
| Immigrants | Yemen | 0.0 /100 | #341 | Tragic 95.2% |
| Immigrants | Central America | 0.0 /100 | #342 | Tragic 95.1% |
| Immigrants | Guatemala | 0.0 /100 | #343 | Tragic 95.1% |