Immigrants from Ghana vs Immigrants from Hungary Disability Age 18 to 34
COMPARE
Immigrants from Ghana
Immigrants from Hungary
Disability Age 18 to 34
Disability Age 18 to 34 Comparison
Immigrants from Ghana
Immigrants from Hungary
6.6%
DISABILITY AGE 18 TO 34
42.1/ 100
METRIC RATING
179th/ 347
METRIC RANK
6.5%
DISABILITY AGE 18 TO 34
69.6/ 100
METRIC RATING
165th/ 347
METRIC RANK
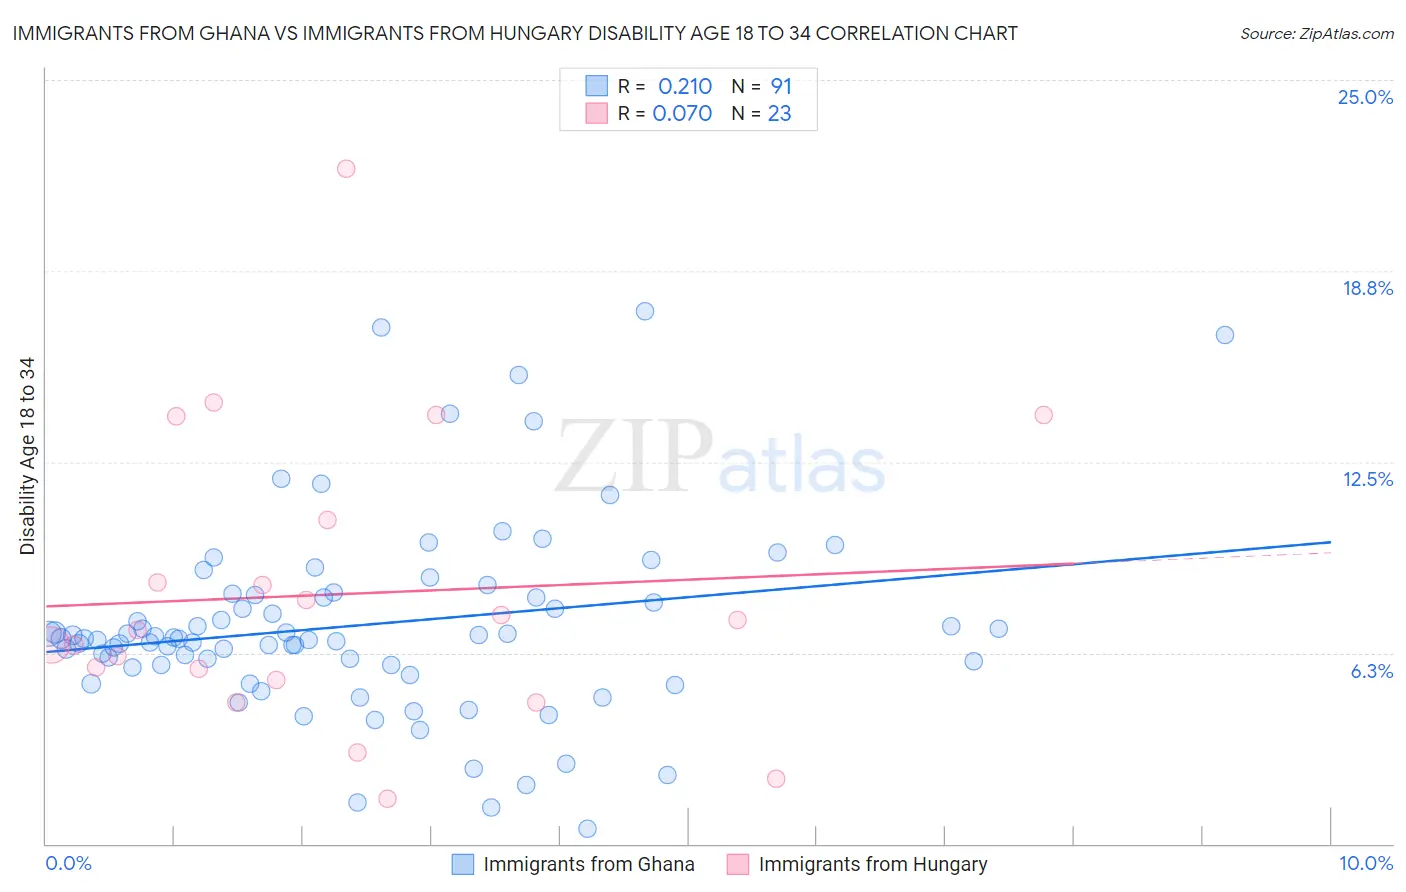
Immigrants from Ghana vs Immigrants from Hungary Disability Age 18 to 34 Correlation Chart
The statistical analysis conducted on geographies consisting of 199,825,304 people shows a weak positive correlation between the proportion of Immigrants from Ghana and percentage of population with a disability between the ages 18 and 35 in the United States with a correlation coefficient (R) of 0.210 and weighted average of 6.6%. Similarly, the statistical analysis conducted on geographies consisting of 195,414,358 people shows a slight positive correlation between the proportion of Immigrants from Hungary and percentage of population with a disability between the ages 18 and 35 in the United States with a correlation coefficient (R) of 0.070 and weighted average of 6.5%, a difference of 2.0%.
Disability Age 18 to 34 Correlation Summary
| Measurement | Immigrants from Ghana | Immigrants from Hungary |
| Minimum | 0.50% | 1.5% |
| Maximum | 17.4% | 22.1% |
| Range | 16.9% | 20.6% |
| Mean | 7.2% | 8.2% |
| Median | 6.7% | 7.0% |
| Interquartile 25% (IQ1) | 5.8% | 5.4% |
| Interquartile 75% (IQ3) | 8.2% | 10.6% |
| Interquartile Range (IQR) | 2.3% | 5.2% |
| Standard Deviation (Sample) | 3.2% | 4.8% |
| Standard Deviation (Population) | 3.1% | 4.7% |
Demographics Similar to Immigrants from Ghana and Immigrants from Hungary by Disability Age 18 to 34
In terms of disability age 18 to 34, the demographic groups most similar to Immigrants from Ghana are Nigerian (6.6%, a difference of 0.11%), Syrian (6.6%, a difference of 0.15%), Immigrants from Austria (6.6%, a difference of 0.18%), Romanian (6.6%, a difference of 0.19%), and U.S. Virgin Islander (6.7%, a difference of 0.25%). Similarly, the demographic groups most similar to Immigrants from Hungary are Immigrants from Nigeria (6.5%, a difference of 0.060%), South African (6.5%, a difference of 0.17%), Immigrants from Denmark (6.5%, a difference of 0.17%), Eastern European (6.5%, a difference of 0.36%), and Immigrants from Northern Europe (6.5%, a difference of 0.44%).
| Demographics | Rating | Rank | Disability Age 18 to 34 |
| South Africans | 71.7 /100 | #162 | Good 6.5% |
| Immigrants | Denmark | 71.7 /100 | #163 | Good 6.5% |
| Immigrants | Nigeria | 70.4 /100 | #164 | Good 6.5% |
| Immigrants | Hungary | 69.6 /100 | #165 | Good 6.5% |
| Eastern Europeans | 65.1 /100 | #166 | Good 6.5% |
| Immigrants | Northern Europe | 64.1 /100 | #167 | Good 6.5% |
| Immigrants | Moldova | 63.1 /100 | #168 | Good 6.5% |
| Russians | 60.2 /100 | #169 | Good 6.5% |
| Immigrants | Bahamas | 57.9 /100 | #170 | Average 6.6% |
| Bahamians | 55.5 /100 | #171 | Average 6.6% |
| Ghanaians | 54.7 /100 | #172 | Average 6.6% |
| Immigrants | Mexico | 54.1 /100 | #173 | Average 6.6% |
| Native Hawaiians | 50.0 /100 | #174 | Average 6.6% |
| Immigrants | Cambodia | 46.5 /100 | #175 | Average 6.6% |
| Immigrants | Africa | 45.9 /100 | #176 | Average 6.6% |
| Syrians | 44.3 /100 | #177 | Average 6.6% |
| Nigerians | 43.7 /100 | #178 | Average 6.6% |
| Immigrants | Ghana | 42.1 /100 | #179 | Average 6.6% |
| Immigrants | Austria | 39.6 /100 | #180 | Fair 6.6% |
| Romanians | 39.5 /100 | #181 | Fair 6.6% |
| U.S. Virgin Islanders | 38.6 /100 | #182 | Fair 6.7% |