Immigrants from France vs Immigrants from Scotland Disability Age Over 75
COMPARE
Immigrants from France
Immigrants from Scotland
Disability Age Over 75
Disability Age Over 75 Comparison
Immigrants from France
Immigrants from Scotland
45.8%
DISABILITY AGE OVER 75
99.7/ 100
METRIC RATING
52nd/ 347
METRIC RANK
45.1%
DISABILITY AGE OVER 75
100.0/ 100
METRIC RATING
14th/ 347
METRIC RANK
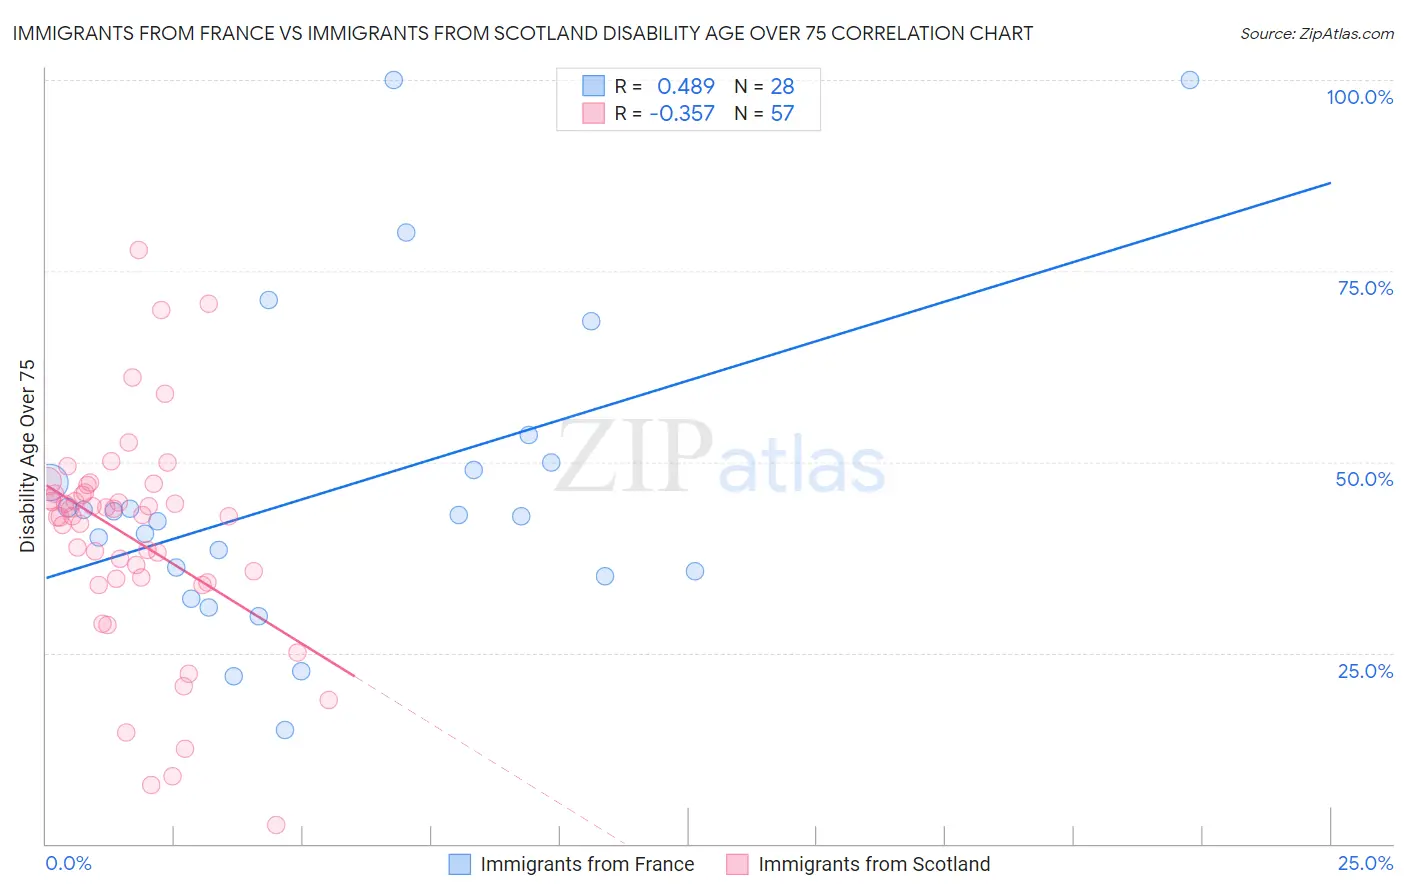
Immigrants from France vs Immigrants from Scotland Disability Age Over 75 Correlation Chart
The statistical analysis conducted on geographies consisting of 287,676,099 people shows a moderate positive correlation between the proportion of Immigrants from France and percentage of population with a disability over the age of 75 in the United States with a correlation coefficient (R) of 0.489 and weighted average of 45.8%. Similarly, the statistical analysis conducted on geographies consisting of 196,341,463 people shows a mild negative correlation between the proportion of Immigrants from Scotland and percentage of population with a disability over the age of 75 in the United States with a correlation coefficient (R) of -0.357 and weighted average of 45.1%, a difference of 1.5%.
Disability Age Over 75 Correlation Summary
| Measurement | Immigrants from France | Immigrants from Scotland |
| Minimum | 15.0% | 2.5% |
| Maximum | 100.0% | 77.8% |
| Range | 85.0% | 75.3% |
| Mean | 46.5% | 40.0% |
| Median | 43.0% | 42.9% |
| Interquartile 25% (IQ1) | 35.4% | 34.5% |
| Interquartile 75% (IQ3) | 49.5% | 46.0% |
| Interquartile Range (IQR) | 14.1% | 11.5% |
| Standard Deviation (Sample) | 20.6% | 14.5% |
| Standard Deviation (Population) | 20.2% | 14.4% |
Similar Demographics by Disability Age Over 75
Demographics Similar to Immigrants from France by Disability Age Over 75
In terms of disability age over 75, the demographic groups most similar to Immigrants from France are Immigrants from Italy (45.8%, a difference of 0.020%), Belgian (45.8%, a difference of 0.050%), Immigrants from Korea (45.8%, a difference of 0.050%), Slovak (45.8%, a difference of 0.090%), and Maltese (45.8%, a difference of 0.10%).
| Demographics | Rating | Rank | Disability Age Over 75 |
| Turks | 99.8 /100 | #45 | Exceptional 45.7% |
| Swedes | 99.8 /100 | #46 | Exceptional 45.7% |
| Immigrants | Canada | 99.8 /100 | #47 | Exceptional 45.7% |
| Croatians | 99.8 /100 | #48 | Exceptional 45.7% |
| Immigrants | North America | 99.8 /100 | #49 | Exceptional 45.7% |
| Belgians | 99.7 /100 | #50 | Exceptional 45.8% |
| Immigrants | Korea | 99.7 /100 | #51 | Exceptional 45.8% |
| Immigrants | France | 99.7 /100 | #52 | Exceptional 45.8% |
| Immigrants | Italy | 99.7 /100 | #53 | Exceptional 45.8% |
| Slovaks | 99.6 /100 | #54 | Exceptional 45.8% |
| Maltese | 99.6 /100 | #55 | Exceptional 45.8% |
| Immigrants | Netherlands | 99.6 /100 | #56 | Exceptional 45.9% |
| Immigrants | Turkey | 99.6 /100 | #57 | Exceptional 45.9% |
| Immigrants | Israel | 99.6 /100 | #58 | Exceptional 45.9% |
| Iranians | 99.6 /100 | #59 | Exceptional 45.9% |
Demographics Similar to Immigrants from Scotland by Disability Age Over 75
In terms of disability age over 75, the demographic groups most similar to Immigrants from Scotland are Latvian (45.1%, a difference of 0.010%), Immigrants from Czechoslovakia (45.1%, a difference of 0.020%), Immigrants from Sweden (45.1%, a difference of 0.040%), Lithuanian (45.1%, a difference of 0.12%), and Immigrants from Northern Europe (45.2%, a difference of 0.14%).
| Demographics | Rating | Rank | Disability Age Over 75 |
| Okinawans | 100.0 /100 | #7 | Exceptional 44.9% |
| Immigrants | Austria | 100.0 /100 | #8 | Exceptional 44.9% |
| Paraguayans | 100.0 /100 | #9 | Exceptional 45.0% |
| Bulgarians | 100.0 /100 | #10 | Exceptional 45.1% |
| Lithuanians | 100.0 /100 | #11 | Exceptional 45.1% |
| Immigrants | Czechoslovakia | 100.0 /100 | #12 | Exceptional 45.1% |
| Latvians | 100.0 /100 | #13 | Exceptional 45.1% |
| Immigrants | Scotland | 100.0 /100 | #14 | Exceptional 45.1% |
| Immigrants | Sweden | 100.0 /100 | #15 | Exceptional 45.1% |
| Immigrants | Northern Europe | 100.0 /100 | #16 | Exceptional 45.2% |
| Immigrants | India | 100.0 /100 | #17 | Exceptional 45.2% |
| Bolivians | 100.0 /100 | #18 | Exceptional 45.2% |
| Immigrants | Greece | 100.0 /100 | #19 | Exceptional 45.2% |
| Immigrants | Serbia | 100.0 /100 | #20 | Exceptional 45.3% |
| Immigrants | Belgium | 100.0 /100 | #21 | Exceptional 45.3% |