Immigrants from Turkey vs Puerto Rican Disability Age Over 75
COMPARE
Immigrants from Turkey
Puerto Rican
Disability Age Over 75
Disability Age Over 75 Comparison
Immigrants from Turkey
Puerto Ricans
45.9%
DISABILITY AGE OVER 75
99.6/ 100
METRIC RATING
57th/ 347
METRIC RANK
52.9%
DISABILITY AGE OVER 75
0.0/ 100
METRIC RATING
330th/ 347
METRIC RANK
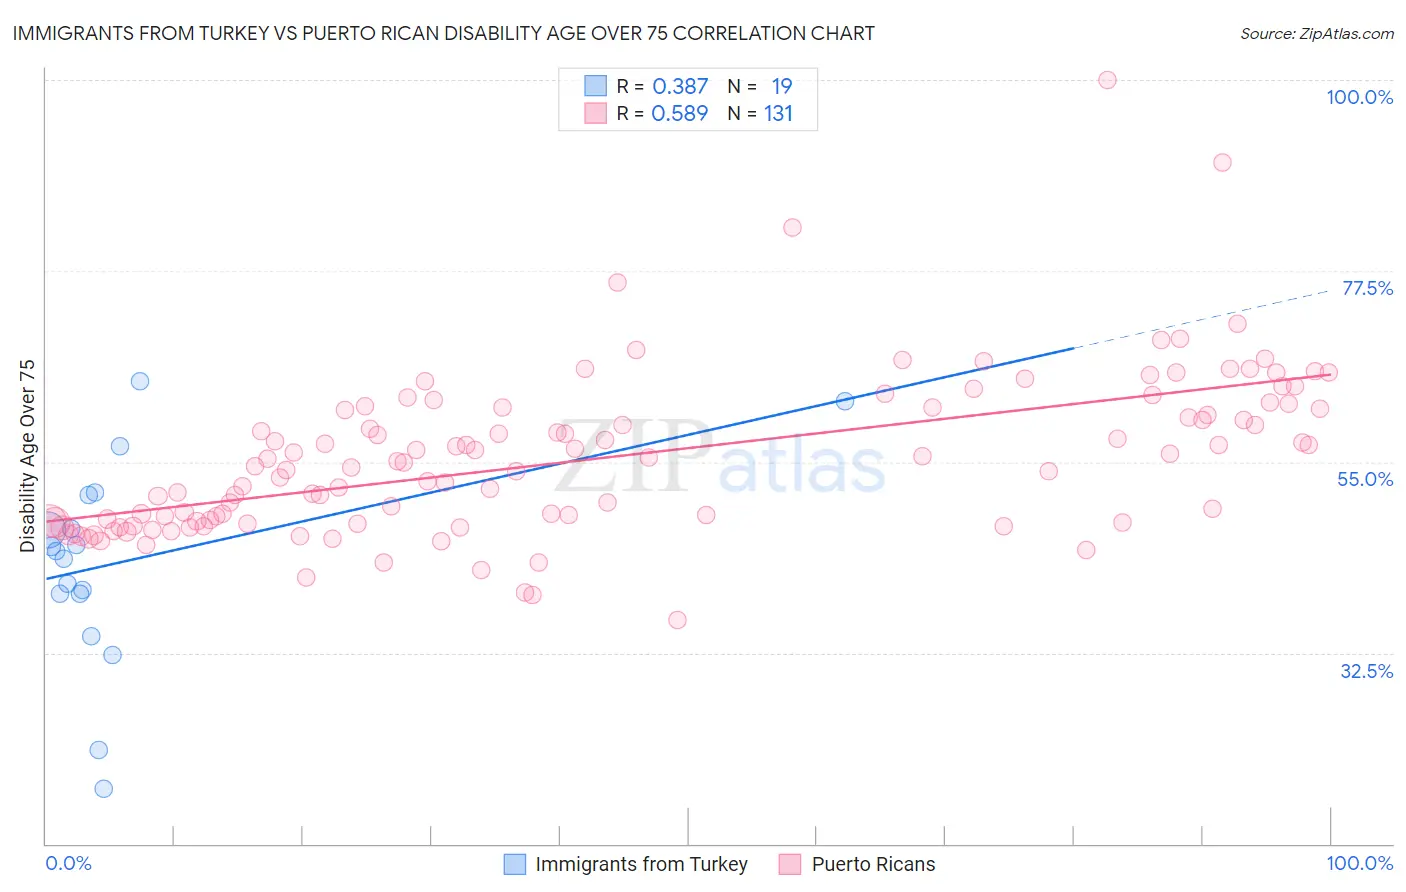
Immigrants from Turkey vs Puerto Rican Disability Age Over 75 Correlation Chart
The statistical analysis conducted on geographies consisting of 222,857,012 people shows a mild positive correlation between the proportion of Immigrants from Turkey and percentage of population with a disability over the age of 75 in the United States with a correlation coefficient (R) of 0.387 and weighted average of 45.9%. Similarly, the statistical analysis conducted on geographies consisting of 526,593,601 people shows a substantial positive correlation between the proportion of Puerto Ricans and percentage of population with a disability over the age of 75 in the United States with a correlation coefficient (R) of 0.589 and weighted average of 52.9%, a difference of 15.3%.
Disability Age Over 75 Correlation Summary
| Measurement | Immigrants from Turkey | Puerto Rican |
| Minimum | 16.4% | 36.4% |
| Maximum | 64.6% | 100.0% |
| Range | 48.1% | 63.6% |
| Mean | 43.3% | 55.4% |
| Median | 44.5% | 54.9% |
| Interquartile 25% (IQ1) | 39.4% | 47.8% |
| Interquartile 75% (IQ3) | 51.0% | 61.4% |
| Interquartile Range (IQR) | 11.6% | 13.6% |
| Standard Deviation (Sample) | 12.1% | 9.6% |
| Standard Deviation (Population) | 11.7% | 9.5% |
Similar Demographics by Disability Age Over 75
Demographics Similar to Immigrants from Turkey by Disability Age Over 75
In terms of disability age over 75, the demographic groups most similar to Immigrants from Turkey are Immigrants from Israel (45.9%, a difference of 0.0%), Immigrants from Netherlands (45.9%, a difference of 0.010%), Iranian (45.9%, a difference of 0.010%), Immigrants from Europe (45.9%, a difference of 0.010%), and Immigrants from Argentina (45.9%, a difference of 0.040%).
| Demographics | Rating | Rank | Disability Age Over 75 |
| Belgians | 99.7 /100 | #50 | Exceptional 45.8% |
| Immigrants | Korea | 99.7 /100 | #51 | Exceptional 45.8% |
| Immigrants | France | 99.7 /100 | #52 | Exceptional 45.8% |
| Immigrants | Italy | 99.7 /100 | #53 | Exceptional 45.8% |
| Slovaks | 99.6 /100 | #54 | Exceptional 45.8% |
| Maltese | 99.6 /100 | #55 | Exceptional 45.8% |
| Immigrants | Netherlands | 99.6 /100 | #56 | Exceptional 45.9% |
| Immigrants | Turkey | 99.6 /100 | #57 | Exceptional 45.9% |
| Immigrants | Israel | 99.6 /100 | #58 | Exceptional 45.9% |
| Iranians | 99.6 /100 | #59 | Exceptional 45.9% |
| Immigrants | Europe | 99.6 /100 | #60 | Exceptional 45.9% |
| Immigrants | Argentina | 99.6 /100 | #61 | Exceptional 45.9% |
| Burmese | 99.5 /100 | #62 | Exceptional 45.9% |
| Immigrants | Norway | 99.5 /100 | #63 | Exceptional 45.9% |
| Immigrants | North Macedonia | 99.5 /100 | #64 | Exceptional 45.9% |
Demographics Similar to Puerto Ricans by Disability Age Over 75
In terms of disability age over 75, the demographic groups most similar to Puerto Ricans are Hopi (52.9%, a difference of 0.020%), Alaska Native (52.8%, a difference of 0.18%), Native/Alaskan (53.1%, a difference of 0.31%), Choctaw (52.7%, a difference of 0.39%), and Nepalese (52.6%, a difference of 0.58%).
| Demographics | Rating | Rank | Disability Age Over 75 |
| Immigrants | Yemen | 0.0 /100 | #323 | Tragic 52.0% |
| Menominee | 0.0 /100 | #324 | Tragic 52.3% |
| Immigrants | Cabo Verde | 0.0 /100 | #325 | Tragic 52.4% |
| Ute | 0.0 /100 | #326 | Tragic 52.6% |
| Nepalese | 0.0 /100 | #327 | Tragic 52.6% |
| Choctaw | 0.0 /100 | #328 | Tragic 52.7% |
| Alaska Natives | 0.0 /100 | #329 | Tragic 52.8% |
| Puerto Ricans | 0.0 /100 | #330 | Tragic 52.9% |
| Hopi | 0.0 /100 | #331 | Tragic 52.9% |
| Natives/Alaskans | 0.0 /100 | #332 | Tragic 53.1% |
| Apache | 0.0 /100 | #333 | Tragic 53.6% |
| Alaskan Athabascans | 0.0 /100 | #334 | Tragic 54.0% |
| Kiowa | 0.0 /100 | #335 | Tragic 54.2% |
| Immigrants | Armenia | 0.0 /100 | #336 | Tragic 54.3% |
| Yuman | 0.0 /100 | #337 | Tragic 54.4% |