Immigrants from Colombia vs Immigrants from Portugal Disability Age 65 to 74

COMPARE

Immigrants from Colombia
Race
Ancestry
AfghanAfricanAlaska NativeAlaskan AthabascanAlbanianAleutAlsatianAmericanApacheArabArapahoArgentineanArmenianAssyrian/Chaldean/SyriacAustralianAustrianBahamianBangladeshiBarbadianBasqueBelgianBelizeanBermudanBhutaneseBlackfeetBolivianBrazilianBritishBritish West IndianBulgarianBurmeseCajunCambodianCanadianCape VerdeanCarpatho RusynCelticCentral AmericanCentral American IndianCherokeeCheyenneChickasawChileanChineseChippewaChoctawColombianColvilleComancheCosta RicanCreeCreekCroatianCrowCubanCypriotCzechCzechoslovakianDanishDelawareDominicanDutchDutch West IndianEastern EuropeanEcuadorianEgyptianEnglishEstonianEthiopianEuropeanFijianFilipinoFinnishFrenchFrench American IndianFrench CanadianGermanGerman RussianGhanaianGreekGuamanian/ChamorroGuatemalanGuyaneseHaitianHmongHonduranHopiHoumaHungarianIcelanderIndian (Asian)IndonesianInupiatIranianIraqiIrishIroquoisIsraeliItalianJamaicanJapaneseJordanianKenyanKiowaKoreanLaotianLatvianLebaneseLiberianLithuanianLumbeeLuxembourgerMacedonianMalaysianMalteseMarshalleseMenomineeMexicanMexican American IndianMongolianMoroccanNative HawaiianNavajoNepaleseNew ZealanderNicaraguanNigerianNorthern EuropeanNorwegianOkinawanOsageOttawaPaiutePakistaniPalestinianPanamanianParaguayanPennsylvania GermanPeruvianPimaPolishPortuguesePotawatomiPuebloPuerto RicanPuget Sound SalishRomanianRussianSalvadoranSamoanScandinavianScotch-IrishScottishSeminoleSenegaleseSerbianShoshoneSierra LeoneanSiouxSlavicSlovakSloveneSomaliSouth AfricanSouth AmericanSouth American IndianSoviet UnionSpaniardSpanishSpanish AmericanSpanish American IndianSri LankanSubsaharan AfricanSudaneseSwedishSwissSyrianTaiwaneseThaiTlingit-HaidaTohono O'OdhamTonganTrinidadian and TobagonianTsimshianTurkishU.S. Virgin IslanderUgandanUkrainianUruguayanUteVenezuelanVietnameseWelshWest IndianYakamaYaquiYugoslavianYumanYup'ikZimbabwean
Immigration
NonimmigrantsImmigrantsAfghanistanAfricaAlbaniaArgentinaArmeniaAsiaAustraliaAustriaBahamasBangladeshBarbadosBelarusBelgiumBelizeBoliviaBosnia and HerzegovinaBrazilBulgariaBurma/MyanmarCabo VerdeCambodiaCameroonCanadaCaribbeanCentral AmericaChileChinaColombiaCongoCosta RicaCroatiaCubaCzechoslovakiaDenmarkDominicaDominican RepublicEastern AfricaEastern AsiaEastern EuropeEcuadorEgyptEl SalvadorEnglandEritreaEthiopiaEuropeFijiFranceGermanyGhanaGreeceGrenadaGuatemalaGuyanaHaitiHondurasHong KongHungaryIndiaIndonesiaIranIraqIrelandIsraelItalyJamaicaJapanJordanKazakhstanKenyaKoreaKuwaitLaosLatin AmericaLatviaLebanonLiberiaLithuaniaMalaysiaMexicoMicronesiaMiddle AfricaMoldovaMoroccoNepalNetherlandsNicaraguaNigeriaNorth AmericaNorth MacedoniaNorthern AfricaNorthern EuropeNorwayOceaniaPakistanPanamaPeruPhilippinesPolandRomaniaRussiaSaudi ArabiaScotlandSenegalSerbiaSierra LeoneSingaporeSomaliaSouth AfricaSouth AmericaSouth Central AsiaSouth Eastern AsiaSouthern EuropeSpainSri LankaSt. Vincent and the GrenadinesSudanSwedenSwitzerlandSyriaTaiwanThailandTrinidad and TobagoTurkeyUgandaUkraineUruguayUzbekistanVenezuelaVietnamWest IndiesWestern AfricaWestern AsiaWestern EuropeYemenZaireZimbabweAzores
Immigrants from Portugal
Race
Ancestry
AfghanAfricanAlaska NativeAlaskan AthabascanAlbanianAleutAlsatianAmericanApacheArabArapahoArgentineanArmenianAssyrian/Chaldean/SyriacAustralianAustrianBahamianBangladeshiBarbadianBasqueBelgianBelizeanBermudanBhutaneseBlackfeetBolivianBrazilianBritishBritish West IndianBulgarianBurmeseCajunCambodianCanadianCape VerdeanCarpatho RusynCelticCentral AmericanCentral American IndianCherokeeCheyenneChickasawChileanChineseChippewaChoctawColombianColvilleComancheCosta RicanCreeCreekCroatianCrowCubanCypriotCzechCzechoslovakianDanishDelawareDominicanDutchDutch West IndianEastern EuropeanEcuadorianEgyptianEnglishEstonianEthiopianEuropeanFijianFilipinoFinnishFrenchFrench American IndianFrench CanadianGermanGerman RussianGhanaianGreekGuamanian/ChamorroGuatemalanGuyaneseHaitianHmongHonduranHopiHoumaHungarianIcelanderIndian (Asian)IndonesianInupiatIranianIraqiIrishIroquoisIsraeliItalianJamaicanJapaneseJordanianKenyanKiowaKoreanLaotianLatvianLebaneseLiberianLithuanianLumbeeLuxembourgerMacedonianMalaysianMalteseMarshalleseMenomineeMexicanMexican American IndianMongolianMoroccanNative HawaiianNavajoNepaleseNew ZealanderNicaraguanNigerianNorthern EuropeanNorwegianOkinawanOsageOttawaPaiutePakistaniPalestinianPanamanianParaguayanPennsylvania GermanPeruvianPimaPolishPortuguesePotawatomiPuebloPuerto RicanPuget Sound SalishRomanianRussianSalvadoranSamoanScandinavianScotch-IrishScottishSeminoleSenegaleseSerbianShoshoneSierra LeoneanSiouxSlavicSlovakSloveneSomaliSouth AfricanSouth AmericanSouth American IndianSoviet UnionSpaniardSpanishSpanish AmericanSpanish American IndianSri LankanSubsaharan AfricanSudaneseSwedishSwissSyrianTaiwaneseThaiTlingit-HaidaTohono O'OdhamTonganTrinidadian and TobagonianTsimshianTurkishU.S. Virgin IslanderUgandanUkrainianUruguayanUteVenezuelanVietnameseWelshWest IndianYakamaYaquiYugoslavianYumanYup'ikZimbabwean
Immigration
NonimmigrantsImmigrantsAfghanistanAfricaAlbaniaArgentinaArmeniaAsiaAustraliaAustriaBahamasBangladeshBarbadosBelarusBelgiumBelizeBoliviaBosnia and HerzegovinaBrazilBulgariaBurma/MyanmarCabo VerdeCambodiaCameroonCanadaCaribbeanCentral AmericaChileChinaCongoCosta RicaCroatiaCubaCzechoslovakiaDenmarkDominicaDominican RepublicEastern AfricaEastern AsiaEastern EuropeEcuadorEgyptEl SalvadorEnglandEritreaEthiopiaEuropeFijiFranceGermanyGhanaGreeceGrenadaGuatemalaGuyanaHaitiHondurasHong KongHungaryIndiaIndonesiaIranIraqIrelandIsraelItalyJamaicaJapanJordanKazakhstanKenyaKoreaKuwaitLaosLatin AmericaLatviaLebanonLiberiaLithuaniaMalaysiaMexicoMicronesiaMiddle AfricaMoldovaMoroccoNepalNetherlandsNicaraguaNigeriaNorth AmericaNorth MacedoniaNorthern AfricaNorthern EuropeNorwayOceaniaPakistanPanamaPeruPhilippinesPolandPortugalRomaniaRussiaSaudi ArabiaScotlandSenegalSerbiaSierra LeoneSingaporeSomaliaSouth AfricaSouth AmericaSouth Central AsiaSouth Eastern AsiaSouthern EuropeSpainSri LankaSt. Vincent and the GrenadinesSudanSwedenSwitzerlandSyriaTaiwanThailandTrinidad and TobagoTurkeyUgandaUkraineUruguayUzbekistanVenezuelaVietnamWest IndiesWestern AfricaWestern AsiaWestern EuropeYemenZaireZimbabweAzores
Disability Age 65 to 74
Income
Poverty
Unemployment
Labor Participation
Family Structure
Vehicle Availability
Education Level
Disability

Disability Age 65 to 74 Comparison

Immigrants from Colombia

Immigrants from Portugal

Exceptional
Poor
22.2%
DISABILITY AGE 65 TO 74
96.8/ 100
METRIC RATING
99th/ 347
METRIC RANK
24.0%
DISABILITY AGE 65 TO 74
11.7/ 100
METRIC RATING
217th/ 347
METRIC RANK

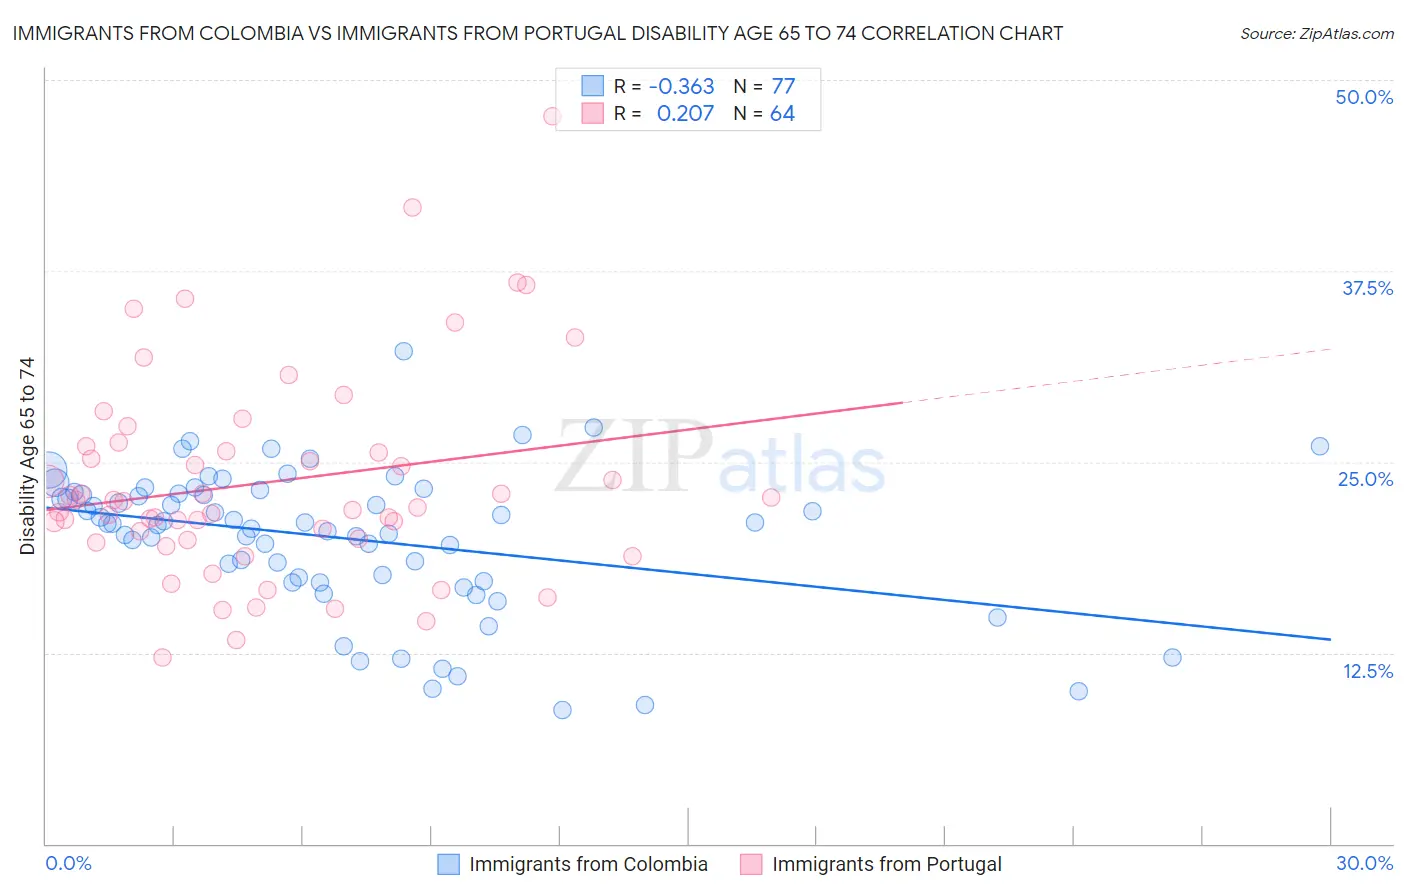
Immigrants from Colombia vs Immigrants from Portugal Disability Age 65 to 74 Correlation Chart

The statistical analysis conducted on geographies consisting of 378,083,554 people shows a mild negative correlation between the proportion of Immigrants from Colombia and percentage of population with a disability between the ages 65 and 75 in the United States with a correlation coefficient (R) of -0.363 and weighted average of 22.2%. Similarly, the statistical analysis conducted on geographies consisting of 174,709,708 people shows a weak positive correlation between the proportion of Immigrants from Portugal and percentage of population with a disability between the ages 65 and 75 in the United States with a correlation coefficient (R) of 0.207 and weighted average of 24.0%, a difference of 8.3%.
Immigrants from Colombia vs Immigrants from Portugal Disability Age 65 to 74

Disability Age 65 to 74 Correlation Summary

MeasurementImmigrants from ColombiaImmigrants from Portugal
Minimum8.8%12.2%
Maximum32.2%47.6%
Range23.4%35.4%
Mean20.0%23.7%
Median21.0%22.2%
Interquartile 25% (IQ1)17.3%19.9%
Interquartile 75% (IQ3)23.0%25.9%
Interquartile Range (IQR)5.6%5.9%
Standard Deviation (Sample)4.7%6.8%
Standard Deviation (Population)4.6%6.7%

Similar Demographics by Disability Age 65 to 74

Demographics Similar to Immigrants from Colombia by Disability Age 65 to 74

In terms of disability age 65 to 74, the demographic groups most similar to Immigrants from Colombia are Jordanian (22.2%, a difference of 0.030%), Uruguayan (22.2%, a difference of 0.13%), Immigrants from England (22.2%, a difference of 0.14%), Immigrants from Saudi Arabia (22.2%, a difference of 0.17%), and South American (22.2%, a difference of 0.19%).
DemographicsRating | RankDisability Age 65 to 74
Poles
97.8
/100
|
#92
Exceptional
22.0%
Immigrants | Canada
97.8
/100
|
#93
Exceptional
22.1%
Immigrants | Chile
97.7
/100
|
#94
Exceptional
22.1%
Romanians
97.7
/100
|
#95
Exceptional
22.1%
Immigrants | North America
97.5
/100
|
#96
Exceptional
22.1%
Immigrants | Southern Europe
97.2
/100
|
#97
Exceptional
22.1%
Jordanians
96.9
/100
|
#98
Exceptional
22.2%
Immigrants | Colombia
96.8
/100
|
#99
Exceptional
22.2%
Uruguayans
96.5
/100
|
#100
Exceptional
22.2%
Immigrants | England
96.5
/100
|
#101
Exceptional
22.2%
Immigrants | Saudi Arabia
96.4
/100
|
#102
Exceptional
22.2%
South Americans
96.4
/100
|
#103
Exceptional
22.2%
Colombians
96.4
/100
|
#104
Exceptional
22.2%
Palestinians
96.3
/100
|
#105
Exceptional
22.2%
Peruvians
96.1
/100
|
#106
Exceptional
22.2%

Demographics Similar to Immigrants from Portugal by Disability Age 65 to 74

In terms of disability age 65 to 74, the demographic groups most similar to Immigrants from Portugal are Immigrants from Nigeria (24.0%, a difference of 0.0%), Immigrants from Burma/Myanmar (24.0%, a difference of 0.020%), Jamaican (24.0%, a difference of 0.070%), Ghanaian (24.1%, a difference of 0.19%), and Pennsylvania German (24.0%, a difference of 0.20%).
DemographicsRating | RankDisability Age 65 to 74
Trinidadians and Tobagonians
16.4
/100
|
#210
Poor
23.9%
Immigrants | West Indies
15.9
/100
|
#211
Poor
23.9%
French
15.7
/100
|
#212
Poor
23.9%
Nicaraguans
14.3
/100
|
#213
Poor
23.9%
Immigrants | Oceania
13.6
/100
|
#214
Poor
24.0%
Pennsylvania Germans
13.3
/100
|
#215
Poor
24.0%
Jamaicans
12.2
/100
|
#216
Poor
24.0%
Immigrants | Portugal
11.7
/100
|
#217
Poor
24.0%
Immigrants | Nigeria
11.7
/100
|
#218
Poor
24.0%
Immigrants | Burma/Myanmar
11.6
/100
|
#219
Poor
24.0%
Ghanaians
10.4
/100
|
#220
Poor
24.1%
Immigrants | Nicaragua
9.8
/100
|
#221
Tragic
24.1%
Native Hawaiians
9.3
/100
|
#222
Tragic
24.1%
Immigrants | Middle Africa
8.9
/100
|
#223
Tragic
24.1%
Immigrants | Panama
8.6
/100
|
#224
Tragic
24.1%