Immigrants from China vs Okinawan Self-Care Disability
COMPARE
Immigrants from China
Okinawan
Self-Care Disability
Self-Care Disability Comparison
Immigrants from China
Okinawans
2.3%
SELF-CARE DISABILITY
99.1/ 100
METRIC RATING
76th/ 347
METRIC RANK
2.2%
SELF-CARE DISABILITY
100.0/ 100
METRIC RATING
15th/ 347
METRIC RANK
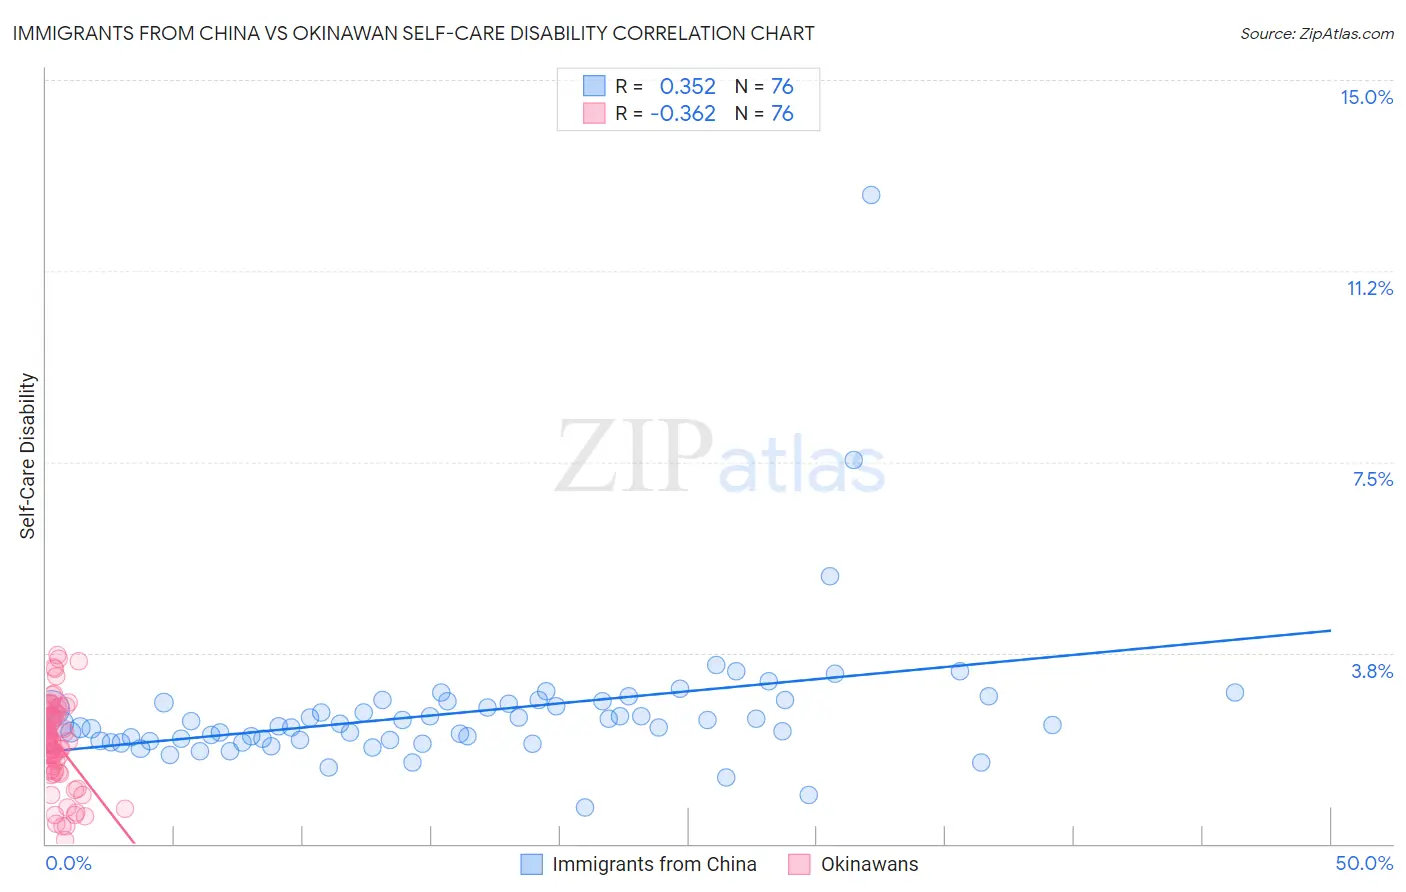
Immigrants from China vs Okinawan Self-Care Disability Correlation Chart
The statistical analysis conducted on geographies consisting of 456,266,069 people shows a mild positive correlation between the proportion of Immigrants from China and percentage of population with self-care disability in the United States with a correlation coefficient (R) of 0.352 and weighted average of 2.3%. Similarly, the statistical analysis conducted on geographies consisting of 73,715,651 people shows a mild negative correlation between the proportion of Okinawans and percentage of population with self-care disability in the United States with a correlation coefficient (R) of -0.362 and weighted average of 2.2%, a difference of 6.0%.
Self-Care Disability Correlation Summary
| Measurement | Immigrants from China | Okinawan |
| Minimum | 0.71% | 0.069% |
| Maximum | 12.8% | 3.7% |
| Range | 12.0% | 3.6% |
| Mean | 2.6% | 2.0% |
| Median | 2.3% | 2.0% |
| Interquartile 25% (IQ1) | 2.0% | 1.4% |
| Interquartile 75% (IQ3) | 2.8% | 2.5% |
| Interquartile Range (IQR) | 0.75% | 1.1% |
| Standard Deviation (Sample) | 1.5% | 0.84% |
| Standard Deviation (Population) | 1.4% | 0.84% |
Similar Demographics by Self-Care Disability
Demographics Similar to Immigrants from China by Self-Care Disability
In terms of self-care disability, the demographic groups most similar to Immigrants from China are Immigrants from Netherlands (2.3%, a difference of 0.010%), Immigrants from Switzerland (2.3%, a difference of 0.050%), Immigrants from Middle Africa (2.3%, a difference of 0.080%), Immigrants from Ireland (2.3%, a difference of 0.080%), and Immigrants from Kenya (2.3%, a difference of 0.090%).
| Demographics | Rating | Rank | Self-Care Disability |
| Immigrants | Norway | 99.2 /100 | #69 | Exceptional 2.3% |
| Immigrants | Northern Europe | 99.2 /100 | #70 | Exceptional 2.3% |
| Asians | 99.2 /100 | #71 | Exceptional 2.3% |
| Eastern Europeans | 99.2 /100 | #72 | Exceptional 2.3% |
| Immigrants | Egypt | 99.1 /100 | #73 | Exceptional 2.3% |
| Immigrants | Switzerland | 99.1 /100 | #74 | Exceptional 2.3% |
| Immigrants | Netherlands | 99.1 /100 | #75 | Exceptional 2.3% |
| Immigrants | China | 99.1 /100 | #76 | Exceptional 2.3% |
| Immigrants | Middle Africa | 99.0 /100 | #77 | Exceptional 2.3% |
| Immigrants | Ireland | 99.0 /100 | #78 | Exceptional 2.3% |
| Immigrants | Kenya | 99.0 /100 | #79 | Exceptional 2.3% |
| Chileans | 98.8 /100 | #80 | Exceptional 2.3% |
| Ugandans | 98.8 /100 | #81 | Exceptional 2.3% |
| Immigrants | Denmark | 98.8 /100 | #82 | Exceptional 2.3% |
| Indians (Asian) | 98.7 /100 | #83 | Exceptional 2.3% |
Demographics Similar to Okinawans by Self-Care Disability
In terms of self-care disability, the demographic groups most similar to Okinawans are Luxembourger (2.2%, a difference of 0.010%), Ethiopian (2.2%, a difference of 0.17%), Immigrants from Ethiopia (2.2%, a difference of 0.18%), Immigrants from South Central Asia (2.2%, a difference of 0.23%), and Immigrants from Kuwait (2.2%, a difference of 0.28%).
| Demographics | Rating | Rank | Self-Care Disability |
| Bolivians | 100.0 /100 | #8 | Exceptional 2.2% |
| Immigrants | Nepal | 100.0 /100 | #9 | Exceptional 2.2% |
| Sudanese | 100.0 /100 | #10 | Exceptional 2.2% |
| Immigrants | South Central Asia | 100.0 /100 | #11 | Exceptional 2.2% |
| Immigrants | Ethiopia | 100.0 /100 | #12 | Exceptional 2.2% |
| Ethiopians | 100.0 /100 | #13 | Exceptional 2.2% |
| Luxembourgers | 100.0 /100 | #14 | Exceptional 2.2% |
| Okinawans | 100.0 /100 | #15 | Exceptional 2.2% |
| Immigrants | Kuwait | 100.0 /100 | #16 | Exceptional 2.2% |
| Immigrants | Saudi Arabia | 100.0 /100 | #17 | Exceptional 2.2% |
| Immigrants | Taiwan | 100.0 /100 | #18 | Exceptional 2.2% |
| Immigrants | Eritrea | 100.0 /100 | #19 | Exceptional 2.2% |
| Tongans | 100.0 /100 | #20 | Exceptional 2.2% |
| Bulgarians | 100.0 /100 | #21 | Exceptional 2.2% |
| Immigrants | Venezuela | 100.0 /100 | #22 | Exceptional 2.2% |