Immigrants from Western Europe vs Immigrants from Ukraine Disability Age 65 to 74
COMPARE
Immigrants from Western Europe
Immigrants from Ukraine
Disability Age 65 to 74
Disability Age 65 to 74 Comparison
Immigrants from Western Europe
Immigrants from Ukraine
22.5%
DISABILITY AGE 65 TO 74
92.3/ 100
METRIC RATING
125th/ 347
METRIC RANK
22.6%
DISABILITY AGE 65 TO 74
88.4/ 100
METRIC RATING
135th/ 347
METRIC RANK
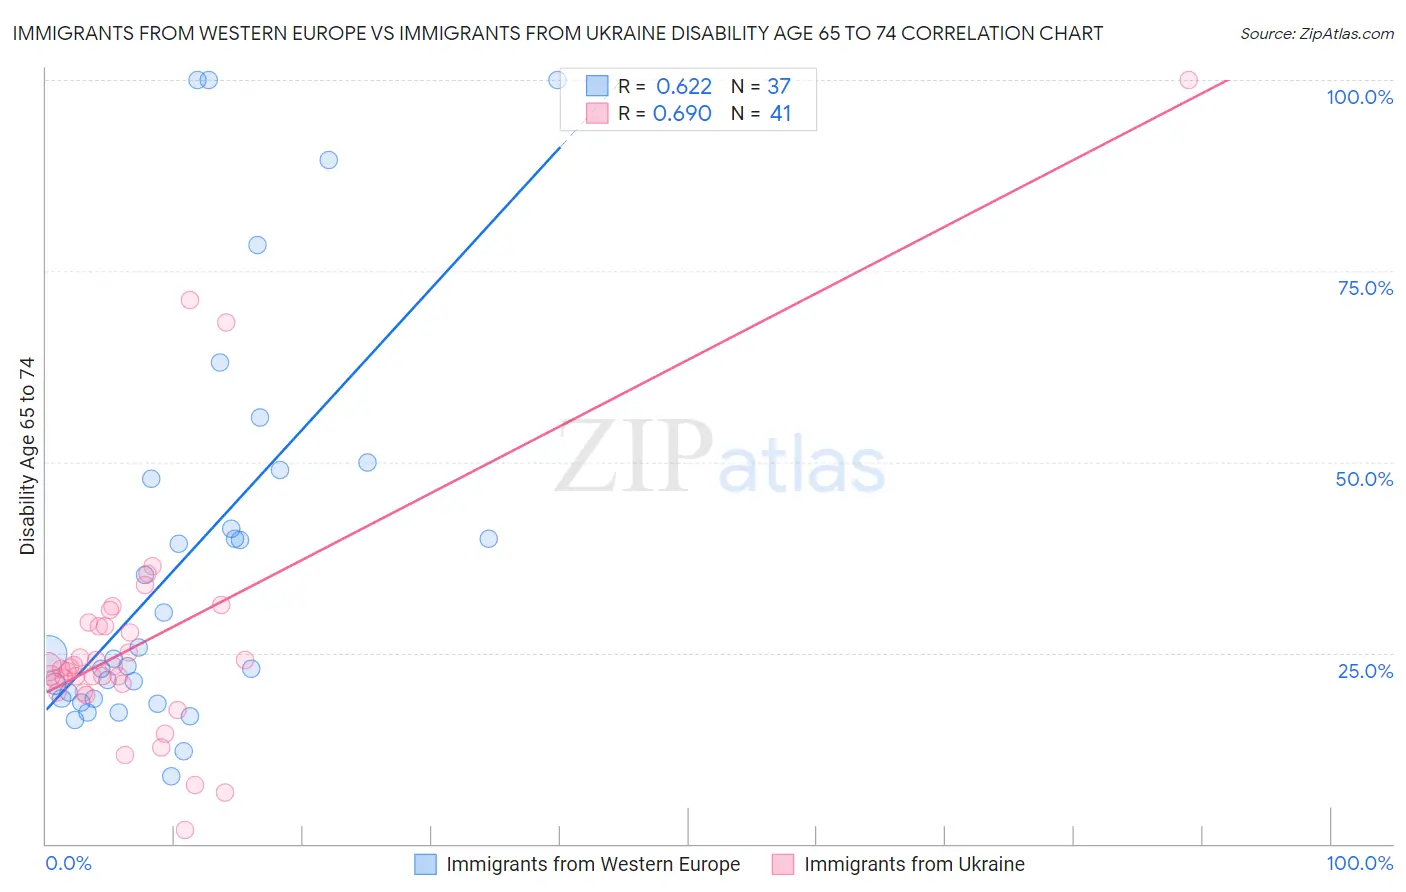
Immigrants from Western Europe vs Immigrants from Ukraine Disability Age 65 to 74 Correlation Chart
The statistical analysis conducted on geographies consisting of 492,995,439 people shows a significant positive correlation between the proportion of Immigrants from Western Europe and percentage of population with a disability between the ages 65 and 75 in the United States with a correlation coefficient (R) of 0.622 and weighted average of 22.5%. Similarly, the statistical analysis conducted on geographies consisting of 289,367,619 people shows a significant positive correlation between the proportion of Immigrants from Ukraine and percentage of population with a disability between the ages 65 and 75 in the United States with a correlation coefficient (R) of 0.690 and weighted average of 22.6%, a difference of 0.69%.
Disability Age 65 to 74 Correlation Summary
| Measurement | Immigrants from Western Europe | Immigrants from Ukraine |
| Minimum | 8.8% | 1.9% |
| Maximum | 100.0% | 100.0% |
| Range | 91.2% | 98.1% |
| Mean | 37.5% | 26.7% |
| Median | 24.8% | 23.2% |
| Interquartile 25% (IQ1) | 19.0% | 20.3% |
| Interquartile 75% (IQ3) | 48.3% | 28.8% |
| Interquartile Range (IQR) | 29.3% | 8.4% |
| Standard Deviation (Sample) | 26.0% | 17.2% |
| Standard Deviation (Population) | 25.7% | 17.0% |
Demographics Similar to Immigrants from Western Europe and Immigrants from Ukraine by Disability Age 65 to 74
In terms of disability age 65 to 74, the demographic groups most similar to Immigrants from Western Europe are Lebanese (22.5%, a difference of 0.020%), Norwegian (22.5%, a difference of 0.040%), Slovak (22.5%, a difference of 0.13%), Hungarian (22.4%, a difference of 0.23%), and Czech (22.4%, a difference of 0.28%). Similarly, the demographic groups most similar to Immigrants from Ukraine are Afghan (22.6%, a difference of 0.030%), Ethiopian (22.7%, a difference of 0.070%), Northern European (22.6%, a difference of 0.080%), Taiwanese (22.7%, a difference of 0.10%), and Costa Rican (22.6%, a difference of 0.13%).
| Demographics | Rating | Rank | Disability Age 65 to 74 |
| Immigrants | Kazakhstan | 93.9 /100 | #120 | Exceptional 22.4% |
| Czechs | 93.5 /100 | #121 | Exceptional 22.4% |
| Immigrants | Jordan | 93.5 /100 | #122 | Exceptional 22.4% |
| Hungarians | 93.3 /100 | #123 | Exceptional 22.4% |
| Norwegians | 92.5 /100 | #124 | Exceptional 22.5% |
| Immigrants | Western Europe | 92.3 /100 | #125 | Exceptional 22.5% |
| Lebanese | 92.2 /100 | #126 | Exceptional 22.5% |
| Slovaks | 91.6 /100 | #127 | Exceptional 22.5% |
| Immigrants | Costa Rica | 90.4 /100 | #128 | Exceptional 22.6% |
| Immigrants | Uruguay | 90.1 /100 | #129 | Exceptional 22.6% |
| Immigrants | Albania | 90.0 /100 | #130 | Excellent 22.6% |
| Immigrants | Nepal | 89.4 /100 | #131 | Excellent 22.6% |
| Costa Ricans | 89.2 /100 | #132 | Excellent 22.6% |
| Northern Europeans | 88.9 /100 | #133 | Excellent 22.6% |
| Afghans | 88.6 /100 | #134 | Excellent 22.6% |
| Immigrants | Ukraine | 88.4 /100 | #135 | Excellent 22.6% |
| Ethiopians | 87.9 /100 | #136 | Excellent 22.7% |
| Taiwanese | 87.6 /100 | #137 | Excellent 22.7% |
| Immigrants | Moldova | 87.3 /100 | #138 | Excellent 22.7% |
| Immigrants | Syria | 85.8 /100 | #139 | Excellent 22.7% |
| Ugandans | 85.4 /100 | #140 | Excellent 22.7% |