Czech vs African Disability Age 18 to 34
COMPARE
Czech
African
Disability Age 18 to 34
Disability Age 18 to 34 Comparison
Czechs
Africans
7.2%
DISABILITY AGE 18 TO 34
0.3/ 100
METRIC RATING
257th/ 347
METRIC RANK
7.4%
DISABILITY AGE 18 TO 34
0.1/ 100
METRIC RATING
274th/ 347
METRIC RANK
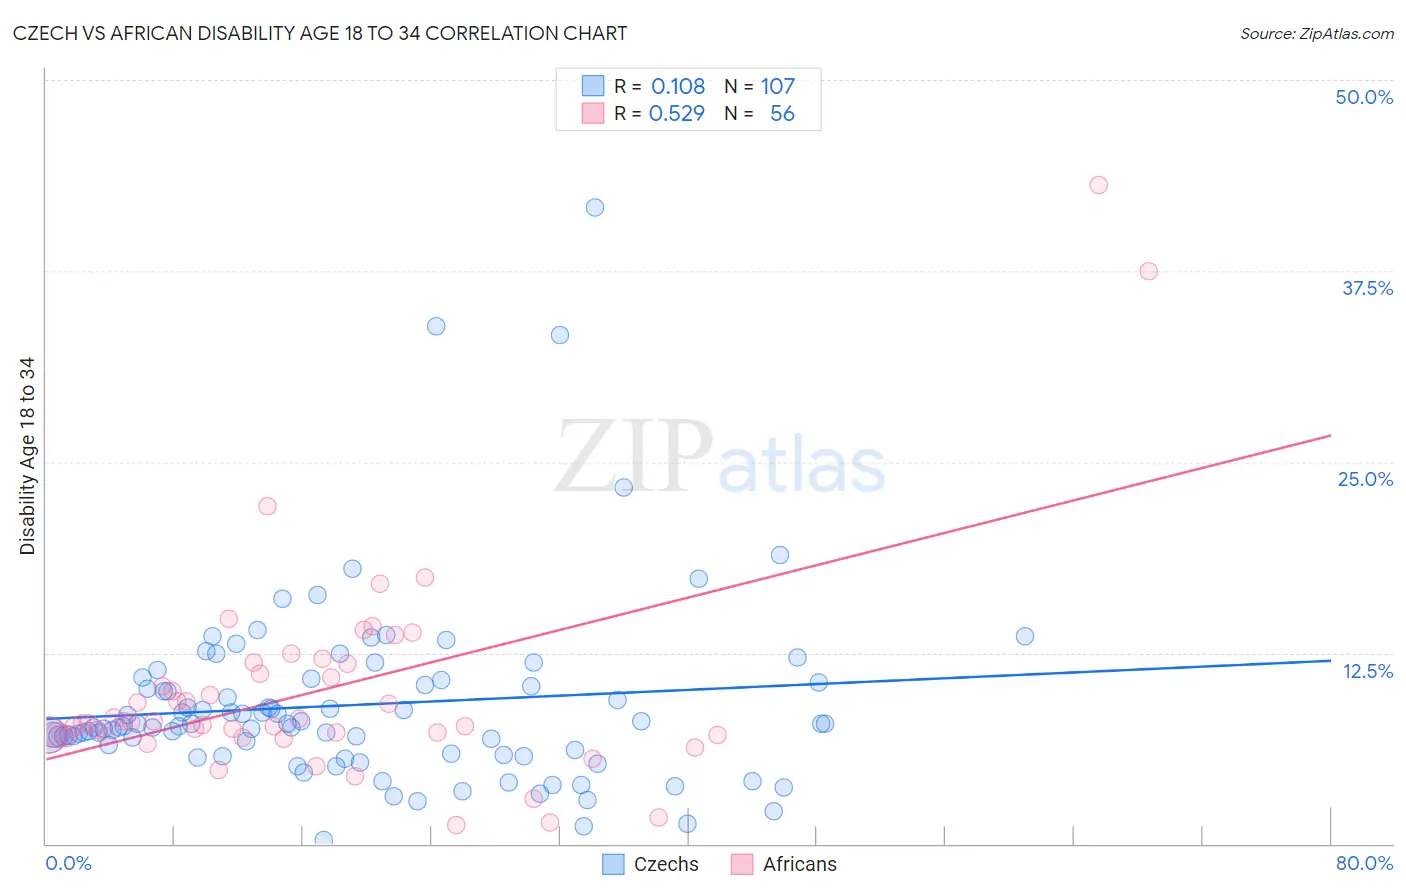
Czech vs African Disability Age 18 to 34 Correlation Chart
The statistical analysis conducted on geographies consisting of 482,183,627 people shows a poor positive correlation between the proportion of Czechs and percentage of population with a disability between the ages 18 and 35 in the United States with a correlation coefficient (R) of 0.108 and weighted average of 7.2%. Similarly, the statistical analysis conducted on geographies consisting of 468,886,209 people shows a substantial positive correlation between the proportion of Africans and percentage of population with a disability between the ages 18 and 35 in the United States with a correlation coefficient (R) of 0.529 and weighted average of 7.4%, a difference of 2.0%.
Disability Age 18 to 34 Correlation Summary
| Measurement | Czech | African |
| Minimum | 0.24% | 1.2% |
| Maximum | 41.7% | 43.1% |
| Range | 41.4% | 41.9% |
| Mean | 9.1% | 10.0% |
| Median | 7.7% | 7.9% |
| Interquartile 25% (IQ1) | 5.9% | 7.1% |
| Interquartile 75% (IQ3) | 10.6% | 11.4% |
| Interquartile Range (IQR) | 4.7% | 4.4% |
| Standard Deviation (Sample) | 6.1% | 7.1% |
| Standard Deviation (Population) | 6.0% | 7.0% |
Demographics Similar to Czechs and Africans by Disability Age 18 to 34
In terms of disability age 18 to 34, the demographic groups most similar to Czechs are Immigrants from Laos (7.2%, a difference of 0.27%), Immigrants from Germany (7.2%, a difference of 0.30%), Immigrants from Micronesia (7.3%, a difference of 0.44%), Somali (7.3%, a difference of 0.51%), and Tohono O'odham (7.3%, a difference of 0.57%). Similarly, the demographic groups most similar to Africans are Slavic (7.4%, a difference of 0.010%), Tsimshian (7.4%, a difference of 0.060%), Immigrants from Somalia (7.4%, a difference of 0.070%), Swiss (7.4%, a difference of 0.15%), and Belgian (7.4%, a difference of 0.20%).
| Demographics | Rating | Rank | Disability Age 18 to 34 |
| Immigrants | Germany | 0.4 /100 | #255 | Tragic 7.2% |
| Immigrants | Laos | 0.4 /100 | #256 | Tragic 7.2% |
| Czechs | 0.3 /100 | #257 | Tragic 7.2% |
| Immigrants | Micronesia | 0.3 /100 | #258 | Tragic 7.3% |
| Somalis | 0.2 /100 | #259 | Tragic 7.3% |
| Tohono O'odham | 0.2 /100 | #260 | Tragic 7.3% |
| Northern Europeans | 0.2 /100 | #261 | Tragic 7.3% |
| Canadians | 0.2 /100 | #262 | Tragic 7.3% |
| British | 0.2 /100 | #263 | Tragic 7.3% |
| Bermudans | 0.1 /100 | #264 | Tragic 7.3% |
| Slovenes | 0.1 /100 | #265 | Tragic 7.3% |
| German Russians | 0.1 /100 | #266 | Tragic 7.4% |
| Bangladeshis | 0.1 /100 | #267 | Tragic 7.4% |
| Portuguese | 0.1 /100 | #268 | Tragic 7.4% |
| Basques | 0.1 /100 | #269 | Tragic 7.4% |
| Belgians | 0.1 /100 | #270 | Tragic 7.4% |
| Swiss | 0.1 /100 | #271 | Tragic 7.4% |
| Tsimshian | 0.1 /100 | #272 | Tragic 7.4% |
| Slavs | 0.1 /100 | #273 | Tragic 7.4% |
| Africans | 0.1 /100 | #274 | Tragic 7.4% |
| Immigrants | Somalia | 0.1 /100 | #275 | Tragic 7.4% |