Immigrants from Bulgaria vs Blackfeet Vision Disability
COMPARE
Immigrants from Bulgaria
Blackfeet
Vision Disability
Vision Disability Comparison
Immigrants from Bulgaria
Blackfeet
2.0%
VISION DISABILITY
99.7/ 100
METRIC RATING
47th/ 347
METRIC RANK
2.6%
VISION DISABILITY
0.0/ 100
METRIC RATING
310th/ 347
METRIC RANK
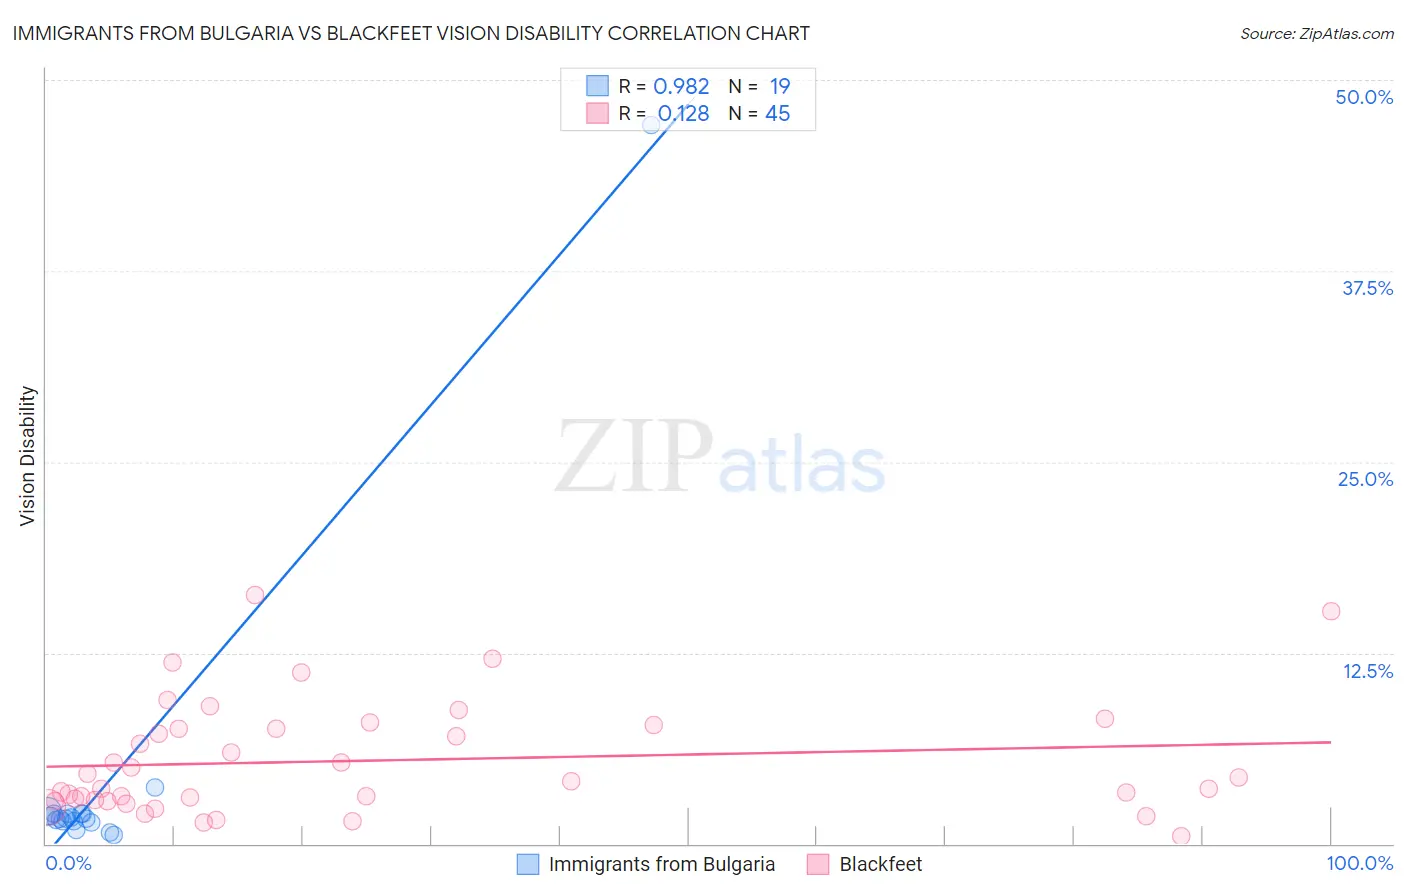
Immigrants from Bulgaria vs Blackfeet Vision Disability Correlation Chart
The statistical analysis conducted on geographies consisting of 172,526,022 people shows a perfect positive correlation between the proportion of Immigrants from Bulgaria and percentage of population with vision disability in the United States with a correlation coefficient (R) of 0.982 and weighted average of 2.0%. Similarly, the statistical analysis conducted on geographies consisting of 309,368,120 people shows a poor positive correlation between the proportion of Blackfeet and percentage of population with vision disability in the United States with a correlation coefficient (R) of 0.128 and weighted average of 2.6%, a difference of 33.1%.
Vision Disability Correlation Summary
| Measurement | Immigrants from Bulgaria | Blackfeet |
| Minimum | 0.56% | 0.51% |
| Maximum | 47.1% | 16.3% |
| Range | 46.5% | 15.8% |
| Mean | 4.1% | 5.4% |
| Median | 1.6% | 4.1% |
| Interquartile 25% (IQ1) | 1.5% | 2.8% |
| Interquartile 75% (IQ3) | 2.0% | 7.6% |
| Interquartile Range (IQR) | 0.48% | 4.8% |
| Standard Deviation (Sample) | 10.4% | 3.7% |
| Standard Deviation (Population) | 10.2% | 3.7% |
Similar Demographics by Vision Disability
Demographics Similar to Immigrants from Bulgaria by Vision Disability
In terms of vision disability, the demographic groups most similar to Immigrants from Bulgaria are Immigrants from Sweden (2.0%, a difference of 0.020%), Ethiopian (2.0%, a difference of 0.060%), Immigrants from Indonesia (2.0%, a difference of 0.090%), Eastern European (2.0%, a difference of 0.11%), and Immigrants from Ethiopia (2.0%, a difference of 0.17%).
| Demographics | Rating | Rank | Vision Disability |
| Immigrants | Ireland | 99.7 /100 | #40 | Exceptional 2.0% |
| Cypriots | 99.7 /100 | #41 | Exceptional 2.0% |
| Immigrants | Ethiopia | 99.7 /100 | #42 | Exceptional 2.0% |
| Eastern Europeans | 99.7 /100 | #43 | Exceptional 2.0% |
| Immigrants | Indonesia | 99.7 /100 | #44 | Exceptional 2.0% |
| Ethiopians | 99.7 /100 | #45 | Exceptional 2.0% |
| Immigrants | Sweden | 99.7 /100 | #46 | Exceptional 2.0% |
| Immigrants | Bulgaria | 99.7 /100 | #47 | Exceptional 2.0% |
| Israelis | 99.6 /100 | #48 | Exceptional 2.0% |
| Latvians | 99.5 /100 | #49 | Exceptional 2.0% |
| Afghans | 99.5 /100 | #50 | Exceptional 2.0% |
| Tongans | 99.5 /100 | #51 | Exceptional 2.0% |
| Immigrants | Serbia | 99.4 /100 | #52 | Exceptional 2.0% |
| Immigrants | Belarus | 99.3 /100 | #53 | Exceptional 2.0% |
| Macedonians | 99.3 /100 | #54 | Exceptional 2.0% |
Demographics Similar to Blackfeet by Vision Disability
In terms of vision disability, the demographic groups most similar to Blackfeet are Dominican (2.6%, a difference of 0.040%), Immigrants from Yemen (2.6%, a difference of 0.32%), Arapaho (2.6%, a difference of 0.61%), Immigrants from Dominican Republic (2.6%, a difference of 0.63%), and Iroquois (2.6%, a difference of 0.65%).
| Demographics | Rating | Rank | Vision Disability |
| Immigrants | Cabo Verde | 0.0 /100 | #303 | Tragic 2.6% |
| Aleuts | 0.0 /100 | #304 | Tragic 2.6% |
| Hispanics or Latinos | 0.0 /100 | #305 | Tragic 2.6% |
| Iroquois | 0.0 /100 | #306 | Tragic 2.6% |
| Immigrants | Dominican Republic | 0.0 /100 | #307 | Tragic 2.6% |
| Arapaho | 0.0 /100 | #308 | Tragic 2.6% |
| Immigrants | Yemen | 0.0 /100 | #309 | Tragic 2.6% |
| Blackfeet | 0.0 /100 | #310 | Tragic 2.6% |
| Dominicans | 0.0 /100 | #311 | Tragic 2.6% |
| Americans | 0.0 /100 | #312 | Tragic 2.6% |
| Potawatomi | 0.0 /100 | #313 | Tragic 2.6% |
| Inupiat | 0.0 /100 | #314 | Tragic 2.7% |
| Osage | 0.0 /100 | #315 | Tragic 2.7% |
| Shoshone | 0.0 /100 | #316 | Tragic 2.7% |
| Yup'ik | 0.0 /100 | #317 | Tragic 2.7% |