Immigrants from Bolivia vs Estonian Disability Age Over 75
COMPARE
Immigrants from Bolivia
Estonian
Disability Age Over 75
Disability Age Over 75 Comparison
Immigrants from Bolivia
Estonians
45.4%
DISABILITY AGE OVER 75
99.9/ 100
METRIC RATING
25th/ 347
METRIC RANK
45.6%
DISABILITY AGE OVER 75
99.9/ 100
METRIC RATING
39th/ 347
METRIC RANK
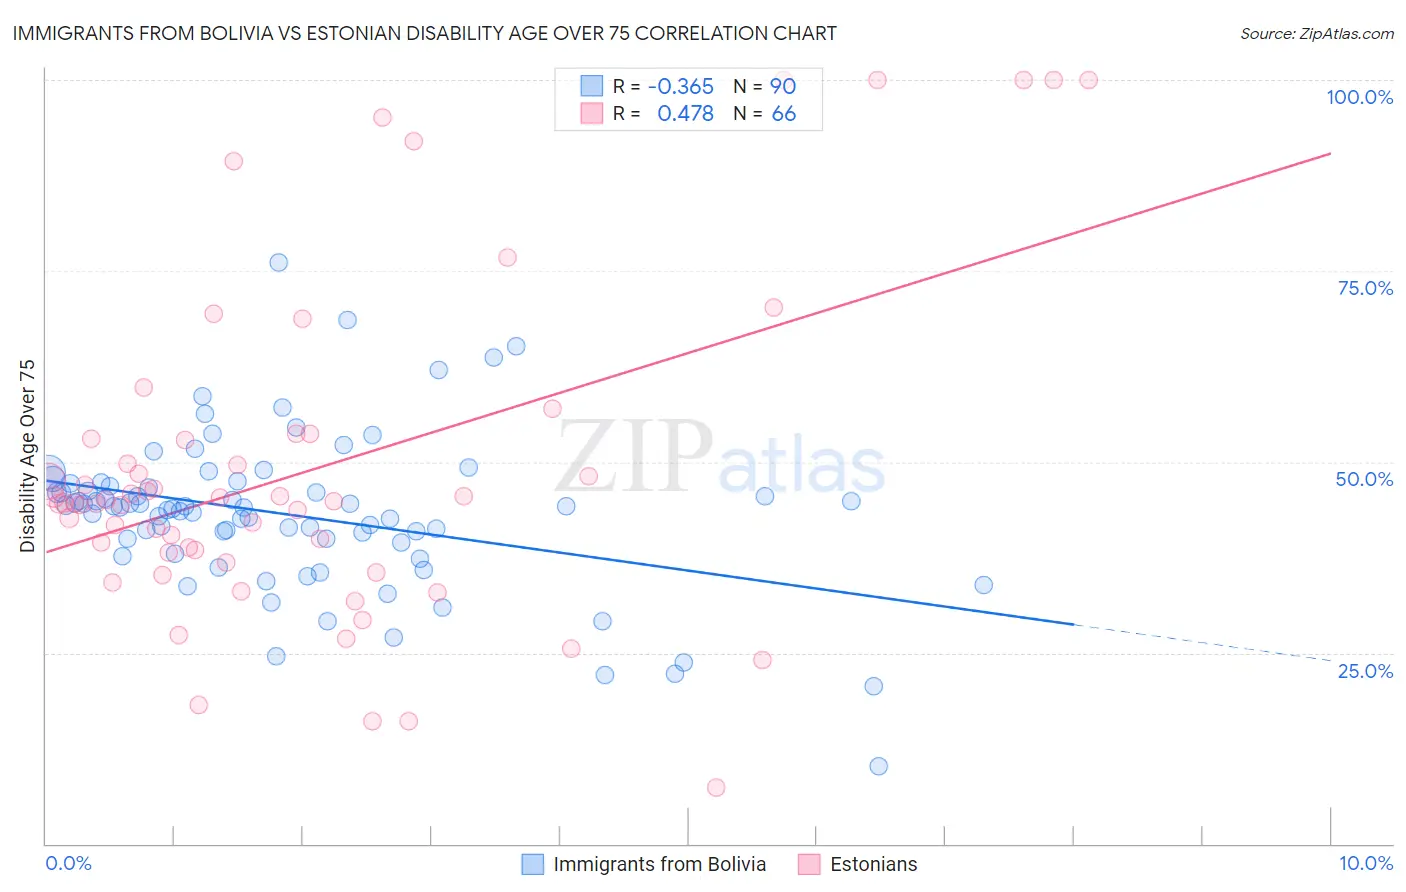
Immigrants from Bolivia vs Estonian Disability Age Over 75 Correlation Chart
The statistical analysis conducted on geographies consisting of 158,656,744 people shows a mild negative correlation between the proportion of Immigrants from Bolivia and percentage of population with a disability over the age of 75 in the United States with a correlation coefficient (R) of -0.365 and weighted average of 45.4%. Similarly, the statistical analysis conducted on geographies consisting of 123,486,929 people shows a moderate positive correlation between the proportion of Estonians and percentage of population with a disability over the age of 75 in the United States with a correlation coefficient (R) of 0.478 and weighted average of 45.6%, a difference of 0.48%.
Disability Age Over 75 Correlation Summary
| Measurement | Immigrants from Bolivia | Estonian |
| Minimum | 10.2% | 7.4% |
| Maximum | 76.1% | 100.0% |
| Range | 65.9% | 92.6% |
| Mean | 43.0% | 49.0% |
| Median | 44.0% | 44.8% |
| Interquartile 25% (IQ1) | 39.4% | 38.1% |
| Interquartile 75% (IQ3) | 46.8% | 53.0% |
| Interquartile Range (IQR) | 7.4% | 14.9% |
| Standard Deviation (Sample) | 10.3% | 21.8% |
| Standard Deviation (Population) | 10.2% | 21.6% |
Demographics Similar to Immigrants from Bolivia and Estonians by Disability Age Over 75
In terms of disability age over 75, the demographic groups most similar to Immigrants from Bolivia are Polish (45.3%, a difference of 0.040%), Macedonian (45.4%, a difference of 0.040%), Immigrants from Poland (45.4%, a difference of 0.050%), Immigrants from Switzerland (45.3%, a difference of 0.070%), and Thai (45.4%, a difference of 0.070%). Similarly, the demographic groups most similar to Estonians are Italian (45.6%, a difference of 0.050%), Slovene (45.6%, a difference of 0.050%), Immigrants from Singapore (45.6%, a difference of 0.090%), Immigrants from Taiwan (45.5%, a difference of 0.11%), and South African (45.5%, a difference of 0.11%).
| Demographics | Rating | Rank | Disability Age Over 75 |
| Immigrants | South Africa | 100.0 /100 | #22 | Exceptional 45.3% |
| Immigrants | Switzerland | 99.9 /100 | #23 | Exceptional 45.3% |
| Poles | 99.9 /100 | #24 | Exceptional 45.3% |
| Immigrants | Bolivia | 99.9 /100 | #25 | Exceptional 45.4% |
| Macedonians | 99.9 /100 | #26 | Exceptional 45.4% |
| Immigrants | Poland | 99.9 /100 | #27 | Exceptional 45.4% |
| Thais | 99.9 /100 | #28 | Exceptional 45.4% |
| Filipinos | 99.9 /100 | #29 | Exceptional 45.4% |
| Immigrants | Denmark | 99.9 /100 | #30 | Exceptional 45.4% |
| Immigrants | Bulgaria | 99.9 /100 | #31 | Exceptional 45.5% |
| Immigrants | Australia | 99.9 /100 | #32 | Exceptional 45.5% |
| Immigrants | Croatia | 99.9 /100 | #33 | Exceptional 45.5% |
| Russians | 99.9 /100 | #34 | Exceptional 45.5% |
| Norwegians | 99.9 /100 | #35 | Exceptional 45.5% |
| Immigrants | Taiwan | 99.9 /100 | #36 | Exceptional 45.5% |
| South Africans | 99.9 /100 | #37 | Exceptional 45.5% |
| Italians | 99.9 /100 | #38 | Exceptional 45.6% |
| Estonians | 99.9 /100 | #39 | Exceptional 45.6% |
| Slovenes | 99.9 /100 | #40 | Exceptional 45.6% |
| Immigrants | Singapore | 99.8 /100 | #41 | Exceptional 45.6% |
| Greeks | 99.8 /100 | #42 | Exceptional 45.6% |