Immigrants from Bangladesh vs Immigrants from Ireland Cognitive Disability
COMPARE
Immigrants from Bangladesh
Immigrants from Ireland
Cognitive Disability
Cognitive Disability Comparison
Immigrants from Bangladesh
Immigrants from Ireland
17.8%
COGNITIVE DISABILITY
1.0/ 100
METRIC RATING
243rd/ 347
METRIC RANK
16.1%
COGNITIVE DISABILITY
100.0/ 100
METRIC RATING
7th/ 347
METRIC RANK
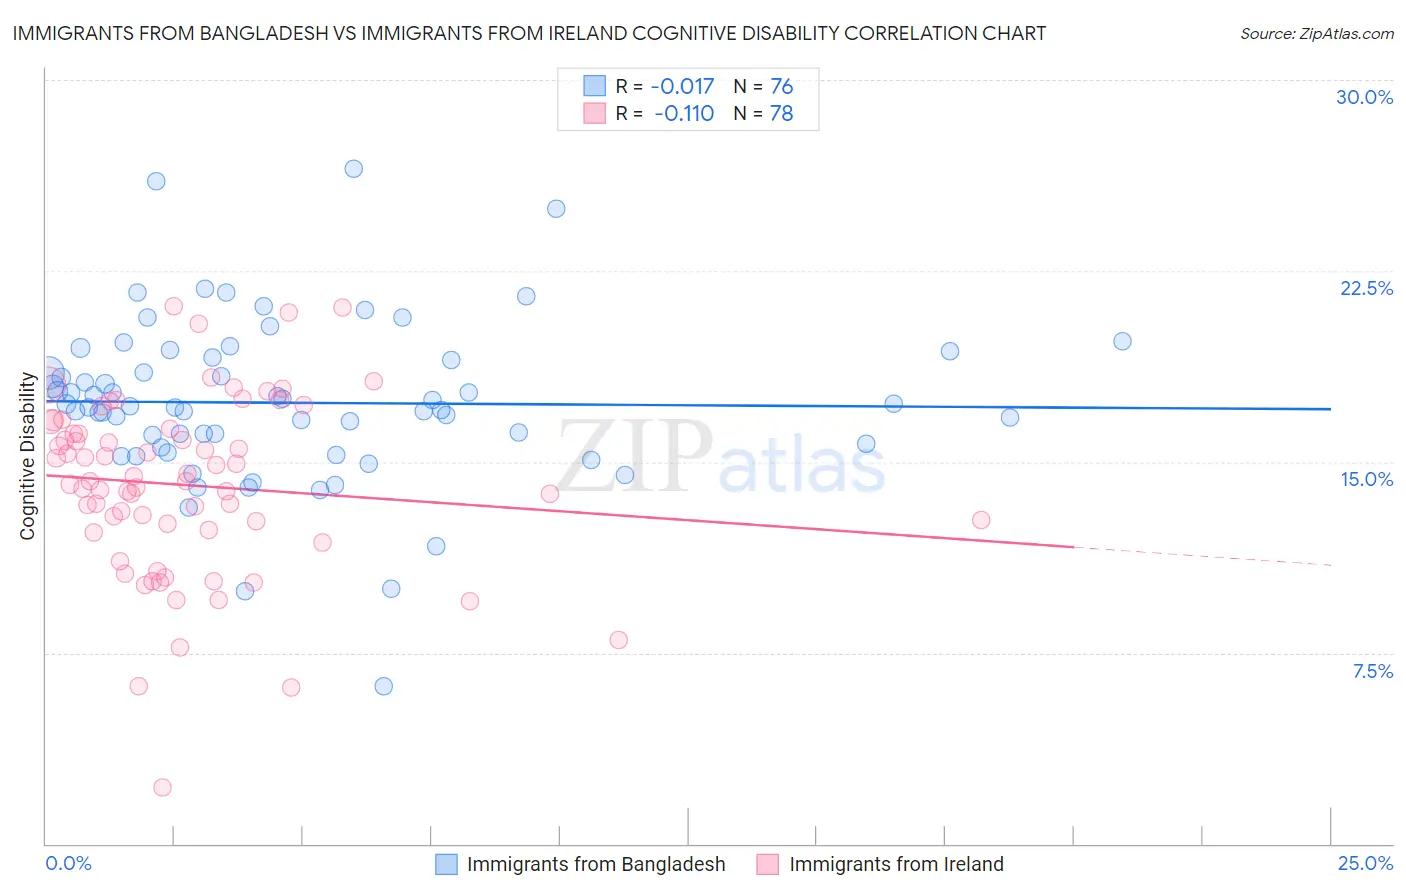
Immigrants from Bangladesh vs Immigrants from Ireland Cognitive Disability Correlation Chart
The statistical analysis conducted on geographies consisting of 203,670,223 people shows no correlation between the proportion of Immigrants from Bangladesh and percentage of population with cognitive disability in the United States with a correlation coefficient (R) of -0.017 and weighted average of 17.8%. Similarly, the statistical analysis conducted on geographies consisting of 240,767,768 people shows a poor negative correlation between the proportion of Immigrants from Ireland and percentage of population with cognitive disability in the United States with a correlation coefficient (R) of -0.110 and weighted average of 16.1%, a difference of 10.6%.
Cognitive Disability Correlation Summary
| Measurement | Immigrants from Bangladesh | Immigrants from Ireland |
| Minimum | 6.2% | 2.2% |
| Maximum | 26.5% | 21.1% |
| Range | 20.3% | 18.9% |
| Mean | 17.3% | 14.1% |
| Median | 17.2% | 14.2% |
| Interquartile 25% (IQ1) | 15.6% | 12.3% |
| Interquartile 75% (IQ3) | 19.1% | 16.3% |
| Interquartile Range (IQR) | 3.4% | 4.0% |
| Standard Deviation (Sample) | 3.2% | 3.5% |
| Standard Deviation (Population) | 3.2% | 3.5% |
Similar Demographics by Cognitive Disability
Demographics Similar to Immigrants from Bangladesh by Cognitive Disability
In terms of cognitive disability, the demographic groups most similar to Immigrants from Bangladesh are Jamaican (17.9%, a difference of 0.040%), Paiute (17.8%, a difference of 0.070%), Mexican (17.8%, a difference of 0.090%), Trinidadian and Tobagonian (17.9%, a difference of 0.13%), and Immigrants from Thailand (17.9%, a difference of 0.15%).
| Demographics | Rating | Rank | Cognitive Disability |
| Immigrants | Iraq | 1.8 /100 | #236 | Tragic 17.8% |
| Immigrants | Mexico | 1.8 /100 | #237 | Tragic 17.8% |
| Cheyenne | 1.7 /100 | #238 | Tragic 17.8% |
| Cajuns | 1.4 /100 | #239 | Tragic 17.8% |
| Iraqis | 1.4 /100 | #240 | Tragic 17.8% |
| Mexicans | 1.1 /100 | #241 | Tragic 17.8% |
| Paiute | 1.1 /100 | #242 | Tragic 17.8% |
| Immigrants | Bangladesh | 1.0 /100 | #243 | Tragic 17.8% |
| Jamaicans | 0.9 /100 | #244 | Tragic 17.9% |
| Trinidadians and Tobagonians | 0.8 /100 | #245 | Tragic 17.9% |
| Immigrants | Thailand | 0.8 /100 | #246 | Tragic 17.9% |
| Samoans | 0.7 /100 | #247 | Tragic 17.9% |
| French American Indians | 0.7 /100 | #248 | Tragic 17.9% |
| Cree | 0.7 /100 | #249 | Tragic 17.9% |
| Immigrants | Ethiopia | 0.7 /100 | #250 | Tragic 17.9% |
Demographics Similar to Immigrants from Ireland by Cognitive Disability
In terms of cognitive disability, the demographic groups most similar to Immigrants from Ireland are Immigrants from Poland (16.1%, a difference of 0.020%), Thai (16.1%, a difference of 0.11%), Assyrian/Chaldean/Syriac (16.2%, a difference of 0.34%), Immigrants from Scotland (16.2%, a difference of 0.38%), and Immigrants from Czechoslovakia (16.2%, a difference of 0.47%).
| Demographics | Rating | Rank | Cognitive Disability |
| Immigrants | Taiwan | 100.0 /100 | #1 | Exceptional 15.7% |
| Immigrants | India | 100.0 /100 | #2 | Exceptional 15.9% |
| Chinese | 100.0 /100 | #3 | Exceptional 15.9% |
| Immigrants | Lithuania | 100.0 /100 | #4 | Exceptional 16.0% |
| Immigrants | Hong Kong | 100.0 /100 | #5 | Exceptional 16.0% |
| Thais | 100.0 /100 | #6 | Exceptional 16.1% |
| Immigrants | Ireland | 100.0 /100 | #7 | Exceptional 16.1% |
| Immigrants | Poland | 100.0 /100 | #8 | Exceptional 16.1% |
| Assyrians/Chaldeans/Syriacs | 100.0 /100 | #9 | Exceptional 16.2% |
| Immigrants | Scotland | 100.0 /100 | #10 | Exceptional 16.2% |
| Immigrants | Czechoslovakia | 100.0 /100 | #11 | Exceptional 16.2% |
| Maltese | 100.0 /100 | #12 | Exceptional 16.2% |
| Lithuanians | 100.0 /100 | #13 | Exceptional 16.3% |
| Immigrants | Austria | 100.0 /100 | #14 | Exceptional 16.3% |
| Immigrants | Greece | 100.0 /100 | #15 | Exceptional 16.3% |