Immigrants from Australia vs Immigrants from Israel Female Disability
COMPARE
Immigrants from Australia
Immigrants from Israel
Female Disability
Female Disability Comparison
Immigrants from Australia
Immigrants from Israel
11.1%
FEMALE DISABILITY
100.0/ 100
METRIC RATING
32nd/ 347
METRIC RANK
10.7%
FEMALE DISABILITY
100.0/ 100
METRIC RATING
12th/ 347
METRIC RANK
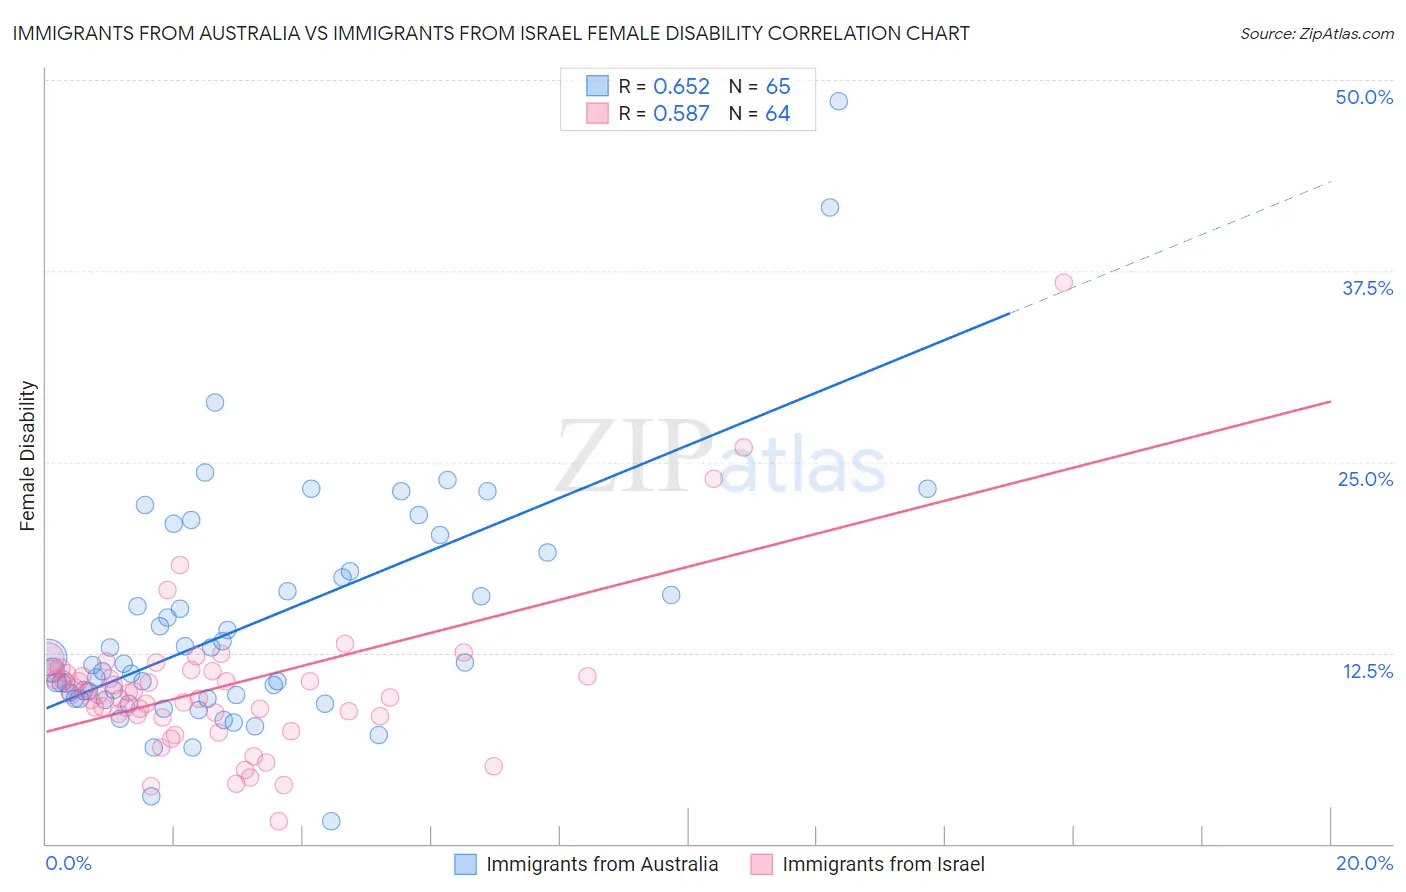
Immigrants from Australia vs Immigrants from Israel Female Disability Correlation Chart
The statistical analysis conducted on geographies consisting of 227,197,779 people shows a significant positive correlation between the proportion of Immigrants from Australia and percentage of females with a disability in the United States with a correlation coefficient (R) of 0.652 and weighted average of 11.1%. Similarly, the statistical analysis conducted on geographies consisting of 210,030,994 people shows a substantial positive correlation between the proportion of Immigrants from Israel and percentage of females with a disability in the United States with a correlation coefficient (R) of 0.587 and weighted average of 10.7%, a difference of 4.2%.
Female Disability Correlation Summary
| Measurement | Immigrants from Australia | Immigrants from Israel |
| Minimum | 1.4% | 1.5% |
| Maximum | 48.6% | 36.7% |
| Range | 47.1% | 35.2% |
| Mean | 14.3% | 10.2% |
| Median | 11.7% | 9.8% |
| Interquartile 25% (IQ1) | 9.5% | 8.4% |
| Interquartile 75% (IQ3) | 17.7% | 11.2% |
| Interquartile Range (IQR) | 8.1% | 2.8% |
| Standard Deviation (Sample) | 7.9% | 5.2% |
| Standard Deviation (Population) | 7.9% | 5.2% |
Demographics Similar to Immigrants from Australia and Immigrants from Israel by Female Disability
In terms of female disability, the demographic groups most similar to Immigrants from Australia are Immigrants from Kuwait (11.1%, a difference of 0.17%), Immigrants from Malaysia (11.1%, a difference of 0.27%), Turkish (11.1%, a difference of 0.27%), Egyptian (11.1%, a difference of 0.33%), and Immigrants from Turkey (11.1%, a difference of 0.61%). Similarly, the demographic groups most similar to Immigrants from Israel are Immigrants from Eastern Asia (10.7%, a difference of 0.070%), Immigrants from China (10.7%, a difference of 0.11%), Burmese (10.7%, a difference of 0.62%), Okinawan (10.8%, a difference of 0.69%), and Indian (Asian) (10.8%, a difference of 1.0%).
| Demographics | Rating | Rank | Female Disability |
| Immigrants | Israel | 100.0 /100 | #12 | Exceptional 10.7% |
| Immigrants | Eastern Asia | 100.0 /100 | #13 | Exceptional 10.7% |
| Immigrants | China | 100.0 /100 | #14 | Exceptional 10.7% |
| Burmese | 100.0 /100 | #15 | Exceptional 10.7% |
| Okinawans | 100.0 /100 | #16 | Exceptional 10.8% |
| Indians (Asian) | 100.0 /100 | #17 | Exceptional 10.8% |
| Immigrants | Iran | 100.0 /100 | #18 | Exceptional 10.8% |
| Immigrants | Venezuela | 100.0 /100 | #19 | Exceptional 10.9% |
| Immigrants | Pakistan | 100.0 /100 | #20 | Exceptional 10.9% |
| Asians | 100.0 /100 | #21 | Exceptional 10.9% |
| Immigrants | Sri Lanka | 100.0 /100 | #22 | Exceptional 10.9% |
| Venezuelans | 100.0 /100 | #23 | Exceptional 11.0% |
| Immigrants | Argentina | 100.0 /100 | #24 | Exceptional 11.0% |
| Immigrants | Asia | 100.0 /100 | #25 | Exceptional 11.0% |
| Argentineans | 100.0 /100 | #26 | Exceptional 11.0% |
| Immigrants | Turkey | 100.0 /100 | #27 | Exceptional 11.1% |
| Egyptians | 100.0 /100 | #28 | Exceptional 11.1% |
| Immigrants | Malaysia | 100.0 /100 | #29 | Exceptional 11.1% |
| Turks | 100.0 /100 | #30 | Exceptional 11.1% |
| Immigrants | Kuwait | 100.0 /100 | #31 | Exceptional 11.1% |
| Immigrants | Australia | 100.0 /100 | #32 | Exceptional 11.1% |