Immigrants from Armenia vs Macedonian Female Disability
COMPARE
Immigrants from Armenia
Macedonian
Female Disability
Female Disability Comparison
Immigrants from Armenia
Macedonians
12.7%
FEMALE DISABILITY
1.0/ 100
METRIC RATING
259th/ 347
METRIC RANK
11.8%
FEMALE DISABILITY
95.5/ 100
METRIC RATING
129th/ 347
METRIC RANK
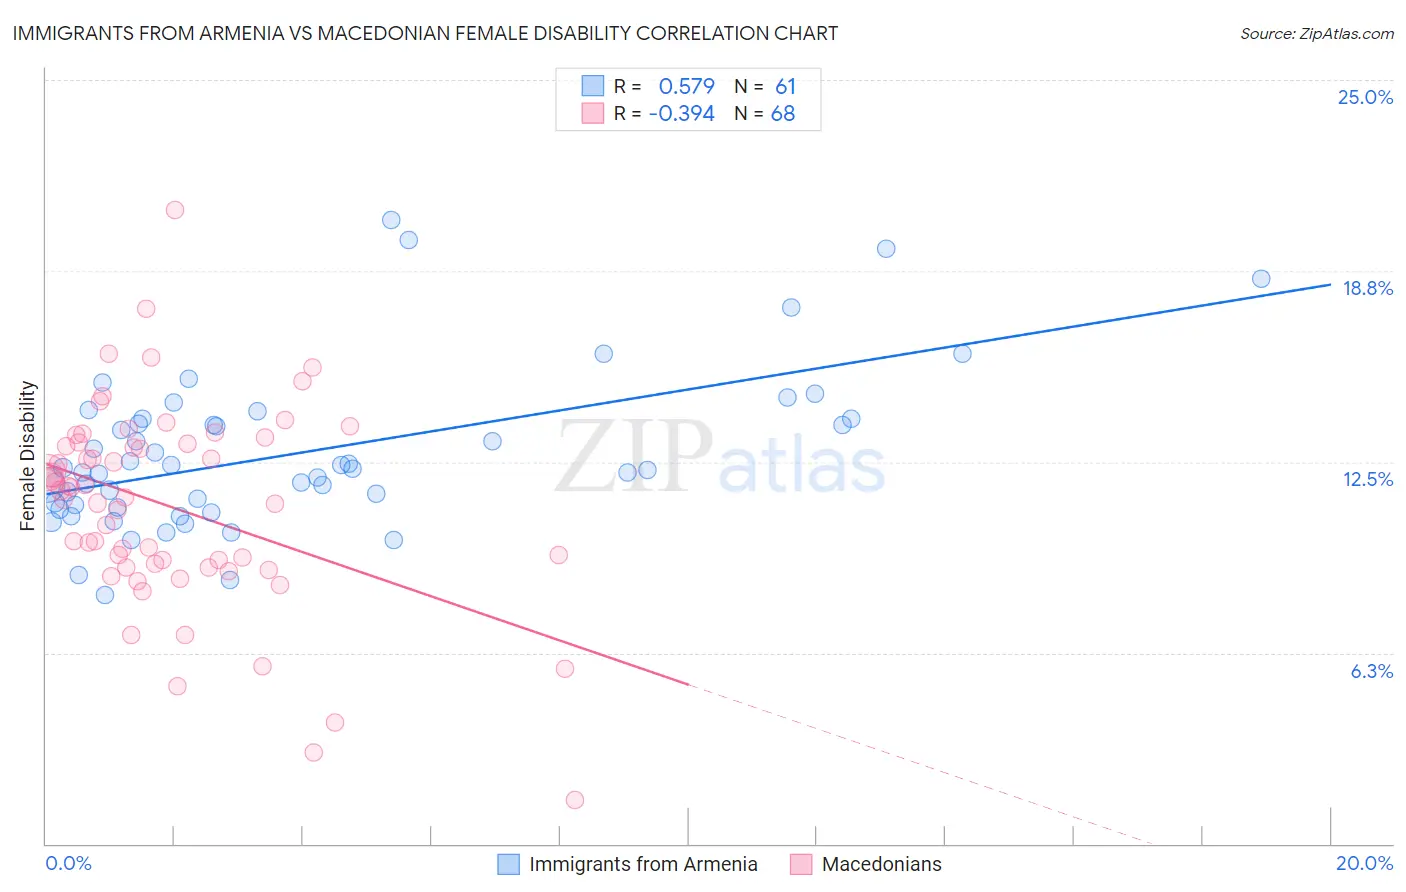
Immigrants from Armenia vs Macedonian Female Disability Correlation Chart
The statistical analysis conducted on geographies consisting of 97,707,143 people shows a substantial positive correlation between the proportion of Immigrants from Armenia and percentage of females with a disability in the United States with a correlation coefficient (R) of 0.579 and weighted average of 12.7%. Similarly, the statistical analysis conducted on geographies consisting of 132,656,541 people shows a mild negative correlation between the proportion of Macedonians and percentage of females with a disability in the United States with a correlation coefficient (R) of -0.394 and weighted average of 11.8%, a difference of 7.4%.
Female Disability Correlation Summary
| Measurement | Immigrants from Armenia | Macedonian |
| Minimum | 8.2% | 1.4% |
| Maximum | 20.4% | 20.8% |
| Range | 12.2% | 19.3% |
| Mean | 12.8% | 11.0% |
| Median | 12.3% | 11.5% |
| Interquartile 25% (IQ1) | 11.0% | 9.1% |
| Interquartile 75% (IQ3) | 13.9% | 13.1% |
| Interquartile Range (IQR) | 2.9% | 4.0% |
| Standard Deviation (Sample) | 2.6% | 3.3% |
| Standard Deviation (Population) | 2.6% | 3.3% |
Similar Demographics by Female Disability
Demographics Similar to Immigrants from Armenia by Female Disability
In terms of female disability, the demographic groups most similar to Immigrants from Armenia are Subsaharan African (12.7%, a difference of 0.010%), Bermudan (12.7%, a difference of 0.050%), Liberian (12.7%, a difference of 0.080%), Aleut (12.7%, a difference of 0.080%), and British West Indian (12.7%, a difference of 0.11%).
| Demographics | Rating | Rank | Female Disability |
| Immigrants | Caribbean | 1.4 /100 | #252 | Tragic 12.7% |
| Jamaicans | 1.4 /100 | #253 | Tragic 12.7% |
| Hawaiians | 1.4 /100 | #254 | Tragic 12.7% |
| Immigrants | Germany | 1.3 /100 | #255 | Tragic 12.7% |
| British West Indians | 1.2 /100 | #256 | Tragic 12.7% |
| Liberians | 1.1 /100 | #257 | Tragic 12.7% |
| Aleuts | 1.1 /100 | #258 | Tragic 12.7% |
| Immigrants | Armenia | 1.0 /100 | #259 | Tragic 12.7% |
| Sub-Saharan Africans | 1.0 /100 | #260 | Tragic 12.7% |
| Bermudans | 1.0 /100 | #261 | Tragic 12.7% |
| Czechoslovakians | 0.9 /100 | #262 | Tragic 12.7% |
| Spaniards | 0.7 /100 | #263 | Tragic 12.8% |
| Alaska Natives | 0.6 /100 | #264 | Tragic 12.8% |
| West Indians | 0.5 /100 | #265 | Tragic 12.8% |
| Finns | 0.4 /100 | #266 | Tragic 12.8% |
Demographics Similar to Macedonians by Female Disability
In terms of female disability, the demographic groups most similar to Macedonians are Immigrants from Latvia (11.8%, a difference of 0.030%), Nicaraguan (11.9%, a difference of 0.060%), South American Indian (11.8%, a difference of 0.070%), Arab (11.9%, a difference of 0.090%), and Immigrants from Europe (11.8%, a difference of 0.17%).
| Demographics | Rating | Rank | Female Disability |
| Immigrants | North Macedonia | 96.8 /100 | #122 | Exceptional 11.8% |
| Immigrants | Croatia | 96.7 /100 | #123 | Exceptional 11.8% |
| Russians | 96.5 /100 | #124 | Exceptional 11.8% |
| Immigrants | Italy | 96.4 /100 | #125 | Exceptional 11.8% |
| Immigrants | Europe | 96.2 /100 | #126 | Exceptional 11.8% |
| South American Indians | 95.8 /100 | #127 | Exceptional 11.8% |
| Immigrants | Latvia | 95.6 /100 | #128 | Exceptional 11.8% |
| Macedonians | 95.5 /100 | #129 | Exceptional 11.8% |
| Nicaraguans | 95.2 /100 | #130 | Exceptional 11.9% |
| Arabs | 95.1 /100 | #131 | Exceptional 11.9% |
| Immigrants | Syria | 94.6 /100 | #132 | Exceptional 11.9% |
| Kenyans | 94.5 /100 | #133 | Exceptional 11.9% |
| Immigrants | Nicaragua | 94.5 /100 | #134 | Exceptional 11.9% |
| Central Americans | 94.2 /100 | #135 | Exceptional 11.9% |
| Ugandans | 94.0 /100 | #136 | Exceptional 11.9% |