Immigrants from Armenia vs Fijian Female Disability
COMPARE
Immigrants from Armenia
Fijian
Female Disability
Female Disability Comparison
Immigrants from Armenia
Fijians
12.7%
FEMALE DISABILITY
1.0/ 100
METRIC RATING
259th/ 347
METRIC RANK
13.1%
FEMALE DISABILITY
0.0/ 100
METRIC RATING
286th/ 347
METRIC RANK
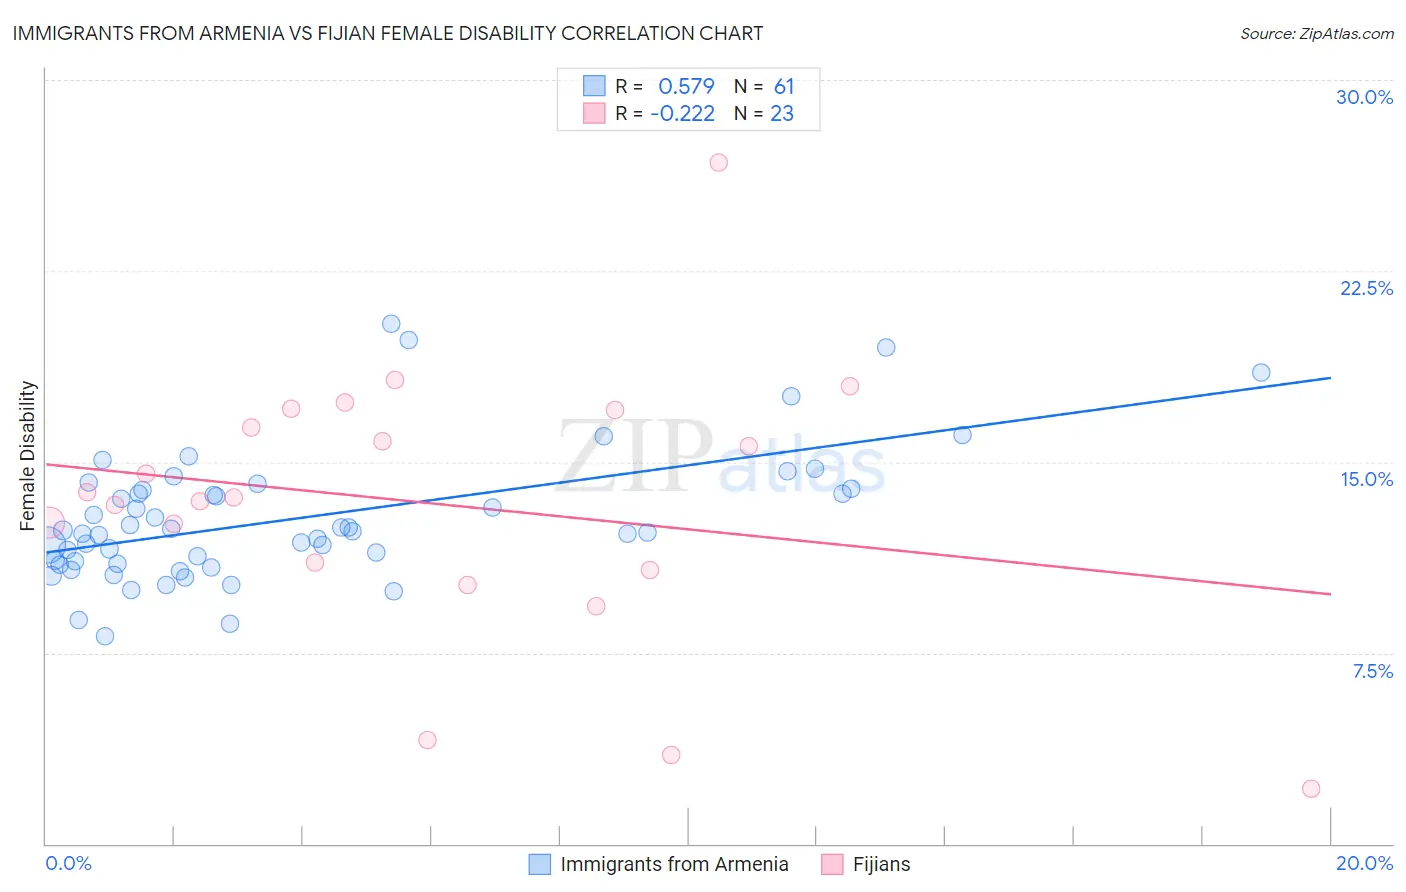
Immigrants from Armenia vs Fijian Female Disability Correlation Chart
The statistical analysis conducted on geographies consisting of 97,707,143 people shows a substantial positive correlation between the proportion of Immigrants from Armenia and percentage of females with a disability in the United States with a correlation coefficient (R) of 0.579 and weighted average of 12.7%. Similarly, the statistical analysis conducted on geographies consisting of 55,947,462 people shows a weak negative correlation between the proportion of Fijians and percentage of females with a disability in the United States with a correlation coefficient (R) of -0.222 and weighted average of 13.1%, a difference of 3.0%.
Female Disability Correlation Summary
| Measurement | Immigrants from Armenia | Fijian |
| Minimum | 8.2% | 2.2% |
| Maximum | 20.4% | 26.8% |
| Range | 12.2% | 24.6% |
| Mean | 12.8% | 13.4% |
| Median | 12.3% | 13.6% |
| Interquartile 25% (IQ1) | 11.0% | 10.8% |
| Interquartile 75% (IQ3) | 13.9% | 17.0% |
| Interquartile Range (IQR) | 2.9% | 6.3% |
| Standard Deviation (Sample) | 2.6% | 5.4% |
| Standard Deviation (Population) | 2.6% | 5.3% |
Similar Demographics by Female Disability
Demographics Similar to Immigrants from Armenia by Female Disability
In terms of female disability, the demographic groups most similar to Immigrants from Armenia are Subsaharan African (12.7%, a difference of 0.010%), Bermudan (12.7%, a difference of 0.050%), Liberian (12.7%, a difference of 0.080%), Aleut (12.7%, a difference of 0.080%), and British West Indian (12.7%, a difference of 0.11%).
| Demographics | Rating | Rank | Female Disability |
| Immigrants | Caribbean | 1.4 /100 | #252 | Tragic 12.7% |
| Jamaicans | 1.4 /100 | #253 | Tragic 12.7% |
| Hawaiians | 1.4 /100 | #254 | Tragic 12.7% |
| Immigrants | Germany | 1.3 /100 | #255 | Tragic 12.7% |
| British West Indians | 1.2 /100 | #256 | Tragic 12.7% |
| Liberians | 1.1 /100 | #257 | Tragic 12.7% |
| Aleuts | 1.1 /100 | #258 | Tragic 12.7% |
| Immigrants | Armenia | 1.0 /100 | #259 | Tragic 12.7% |
| Sub-Saharan Africans | 1.0 /100 | #260 | Tragic 12.7% |
| Bermudans | 1.0 /100 | #261 | Tragic 12.7% |
| Czechoslovakians | 0.9 /100 | #262 | Tragic 12.7% |
| Spaniards | 0.7 /100 | #263 | Tragic 12.8% |
| Alaska Natives | 0.6 /100 | #264 | Tragic 12.8% |
| West Indians | 0.5 /100 | #265 | Tragic 12.8% |
| Finns | 0.4 /100 | #266 | Tragic 12.8% |
Demographics Similar to Fijians by Female Disability
In terms of female disability, the demographic groups most similar to Fijians are Bangladeshi (13.1%, a difference of 0.050%), Hmong (13.1%, a difference of 0.10%), English (13.1%, a difference of 0.23%), Welsh (13.1%, a difference of 0.24%), and U.S. Virgin Islander (13.1%, a difference of 0.32%).
| Demographics | Rating | Rank | Female Disability |
| Arapaho | 0.1 /100 | #279 | Tragic 13.0% |
| Irish | 0.1 /100 | #280 | Tragic 13.1% |
| U.S. Virgin Islanders | 0.1 /100 | #281 | Tragic 13.1% |
| Welsh | 0.0 /100 | #282 | Tragic 13.1% |
| English | 0.0 /100 | #283 | Tragic 13.1% |
| Hmong | 0.0 /100 | #284 | Tragic 13.1% |
| Bangladeshis | 0.0 /100 | #285 | Tragic 13.1% |
| Fijians | 0.0 /100 | #286 | Tragic 13.1% |
| Yaqui | 0.0 /100 | #287 | Tragic 13.2% |
| Whites/Caucasians | 0.0 /100 | #288 | Tragic 13.2% |
| Tlingit-Haida | 0.0 /100 | #289 | Tragic 13.2% |
| Immigrants | Yemen | 0.0 /100 | #290 | Tragic 13.2% |
| Shoshone | 0.0 /100 | #291 | Tragic 13.2% |
| Yakama | 0.0 /100 | #292 | Tragic 13.2% |
| Marshallese | 0.0 /100 | #293 | Tragic 13.3% |