Okinawan vs Macedonian Female Disability
COMPARE
Okinawan
Macedonian
Female Disability
Female Disability Comparison
Okinawans
Macedonians
10.8%
FEMALE DISABILITY
100.0/ 100
METRIC RATING
16th/ 347
METRIC RANK
11.8%
FEMALE DISABILITY
95.5/ 100
METRIC RATING
129th/ 347
METRIC RANK
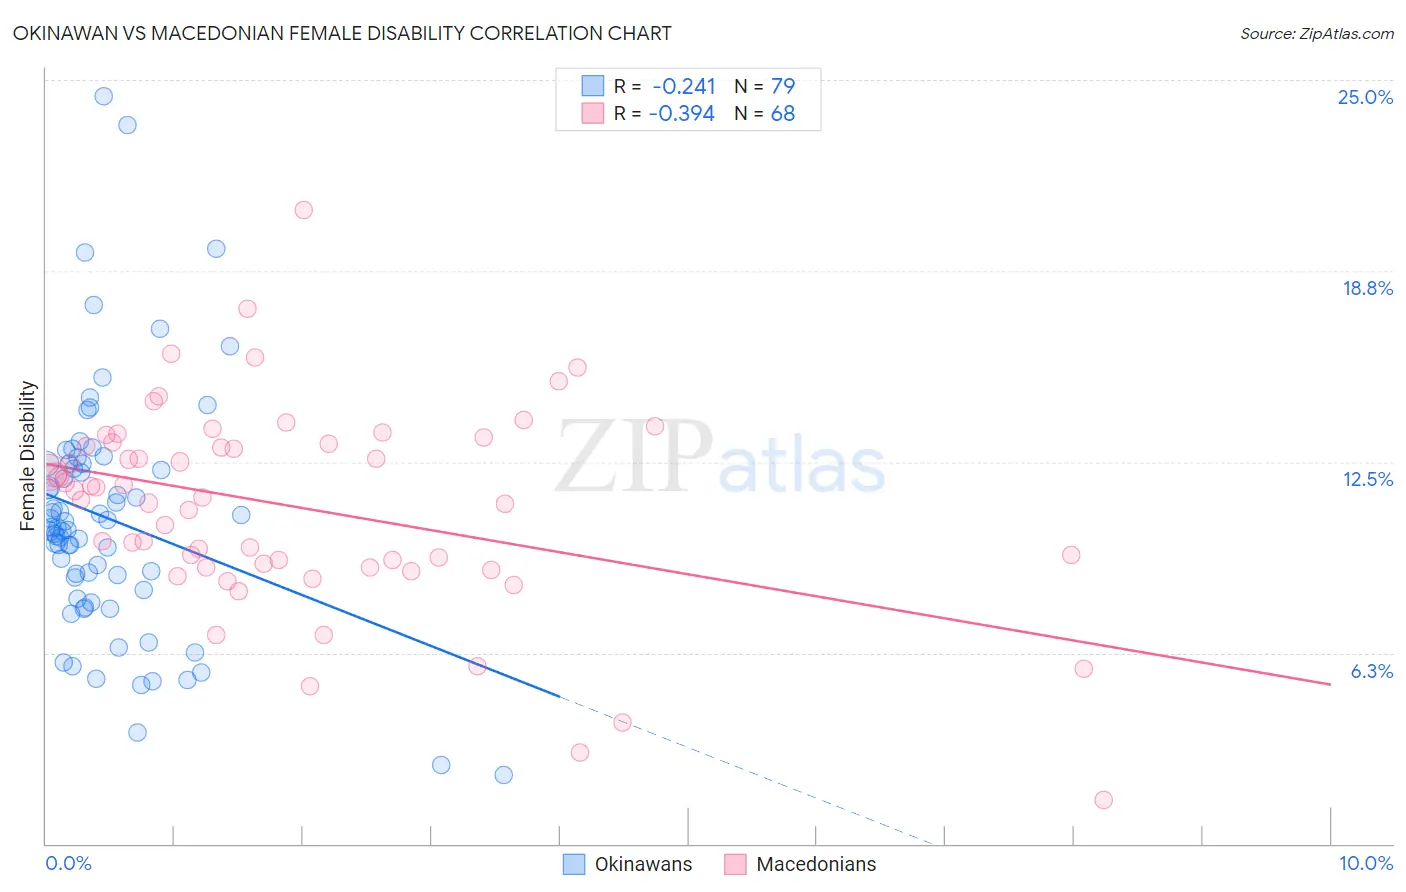
Okinawan vs Macedonian Female Disability Correlation Chart
The statistical analysis conducted on geographies consisting of 73,779,497 people shows a weak negative correlation between the proportion of Okinawans and percentage of females with a disability in the United States with a correlation coefficient (R) of -0.241 and weighted average of 10.8%. Similarly, the statistical analysis conducted on geographies consisting of 132,656,541 people shows a mild negative correlation between the proportion of Macedonians and percentage of females with a disability in the United States with a correlation coefficient (R) of -0.394 and weighted average of 11.8%, a difference of 10.1%.
Female Disability Correlation Summary
| Measurement | Okinawan | Macedonian |
| Minimum | 2.2% | 1.4% |
| Maximum | 24.5% | 20.8% |
| Range | 22.2% | 19.3% |
| Mean | 10.6% | 11.0% |
| Median | 10.3% | 11.5% |
| Interquartile 25% (IQ1) | 8.3% | 9.1% |
| Interquartile 75% (IQ3) | 12.4% | 13.1% |
| Interquartile Range (IQR) | 4.1% | 4.0% |
| Standard Deviation (Sample) | 4.0% | 3.3% |
| Standard Deviation (Population) | 4.0% | 3.3% |
Similar Demographics by Female Disability
Demographics Similar to Okinawans by Female Disability
In terms of female disability, the demographic groups most similar to Okinawans are Burmese (10.7%, a difference of 0.070%), Indian (Asian) (10.8%, a difference of 0.32%), Immigrants from China (10.7%, a difference of 0.58%), Immigrants from Eastern Asia (10.7%, a difference of 0.61%), and Immigrants from Israel (10.7%, a difference of 0.69%).
| Demographics | Rating | Rank | Female Disability |
| Iranians | 100.0 /100 | #9 | Exceptional 10.6% |
| Immigrants | Hong Kong | 100.0 /100 | #10 | Exceptional 10.6% |
| Immigrants | Korea | 100.0 /100 | #11 | Exceptional 10.6% |
| Immigrants | Israel | 100.0 /100 | #12 | Exceptional 10.7% |
| Immigrants | Eastern Asia | 100.0 /100 | #13 | Exceptional 10.7% |
| Immigrants | China | 100.0 /100 | #14 | Exceptional 10.7% |
| Burmese | 100.0 /100 | #15 | Exceptional 10.7% |
| Okinawans | 100.0 /100 | #16 | Exceptional 10.8% |
| Indians (Asian) | 100.0 /100 | #17 | Exceptional 10.8% |
| Immigrants | Iran | 100.0 /100 | #18 | Exceptional 10.8% |
| Immigrants | Venezuela | 100.0 /100 | #19 | Exceptional 10.9% |
| Immigrants | Pakistan | 100.0 /100 | #20 | Exceptional 10.9% |
| Asians | 100.0 /100 | #21 | Exceptional 10.9% |
| Immigrants | Sri Lanka | 100.0 /100 | #22 | Exceptional 10.9% |
| Venezuelans | 100.0 /100 | #23 | Exceptional 11.0% |
Demographics Similar to Macedonians by Female Disability
In terms of female disability, the demographic groups most similar to Macedonians are Immigrants from Latvia (11.8%, a difference of 0.030%), Nicaraguan (11.9%, a difference of 0.060%), South American Indian (11.8%, a difference of 0.070%), Arab (11.9%, a difference of 0.090%), and Immigrants from Europe (11.8%, a difference of 0.17%).
| Demographics | Rating | Rank | Female Disability |
| Immigrants | North Macedonia | 96.8 /100 | #122 | Exceptional 11.8% |
| Immigrants | Croatia | 96.7 /100 | #123 | Exceptional 11.8% |
| Russians | 96.5 /100 | #124 | Exceptional 11.8% |
| Immigrants | Italy | 96.4 /100 | #125 | Exceptional 11.8% |
| Immigrants | Europe | 96.2 /100 | #126 | Exceptional 11.8% |
| South American Indians | 95.8 /100 | #127 | Exceptional 11.8% |
| Immigrants | Latvia | 95.6 /100 | #128 | Exceptional 11.8% |
| Macedonians | 95.5 /100 | #129 | Exceptional 11.8% |
| Nicaraguans | 95.2 /100 | #130 | Exceptional 11.9% |
| Arabs | 95.1 /100 | #131 | Exceptional 11.9% |
| Immigrants | Syria | 94.6 /100 | #132 | Exceptional 11.9% |
| Kenyans | 94.5 /100 | #133 | Exceptional 11.9% |
| Immigrants | Nicaragua | 94.5 /100 | #134 | Exceptional 11.9% |
| Central Americans | 94.2 /100 | #135 | Exceptional 11.9% |
| Ugandans | 94.0 /100 | #136 | Exceptional 11.9% |